- What is a Species Distribution Model?
- Types of SDMs
- SDMs supported by Biosecurity Commons
- The importance of filtering & cleaning occurrence records
- Selecting model covariates
- Assessing extrapolation and environmental novelty
- Evaluating model performance
- Common Mistakes in SDM
- Want to use our R package?
- References
This article is focused on providing a more in-depth understanding of Species Distribution Models. If you are interested in a step-by-step guide on how to use the Biosecurity Commons interface for SDM modelling please see our SDM Quick Start Guide.
What is a Species Distribution Model?
A Species Distribution Model (SDM) is a quantitative tool used to estimate the relative suitability of environmental conditions for the establishment and persistence of a particular species across a landscape. For invasive species, SDMs are commonly parameterised using global climatic variables, which are among the most widely available and consistently measured environmental datasets. As a result, they are often referred to as climate suitability models (Camac et al. 2024). By identifying where environmental conditions are likely to support establishment and persistence, SDMs provide an evidence base for a range of biosecurity decisions, including:
- Establishment risk assessment: Identifying regions environmentally suitable for establishment following introduction.
- Surveillance design: Guiding the allocation of surveillance resources towards areas with the highest establishment potential.
- Proof of freedom: Supporting claims of absence by identifying where a species could realistically establish and persist.
- Impact assessment: Delineating the potential extent of establishment to support estimates of economic, environmental, and social impacts.
Types of SDMs
There are two primary approaches to species distribution modelling (Elith 2017; Camac et al. 2024):
Correlative models
Correlative models estimate environmental suitability by identifying statistical relationships between a species' known occurrence records and spatial environmental variables. These relationships are then used to predict the relative suitability of environmental conditions across unsampled locations. Correlative models encompass several broad classes of methods, including discrimination (or two-class) models that contrast species presences with background or absence data (e.g. Maxent, GLMs, GAMs, and boosted regression trees), environmental profile models that characterise the environmental conditions associated with known occurrences (e.g. BIOCLIM and Range bagging), and distance-based approaches that quantify the environmental similarity between candidate locations and the species' observed environmental profile (e.g. CLIMATCH). Correlative models are the most widely used approach in biosecurity because they can be parameterised using readily available occurrence records and globally available environmental datasets. Their primary limitation is that predictions are based on observed associations rather than the biological processes that determine whether a species can survive, grow, reproduce, and persist. Consequently, predictions should be interpreted with caution when extrapolating to novel environments, future climates, or regions that differ substantially from those represented by the occurrence data, as the statistical relationships used to fit the model may no longer hold.
Process-based (mechanistic) models
Process-based (mechanistic) models estimate environmental suitability by explicitly representing the biological, physiological, and demographic processes that determine whether a species can survive, grow, reproduce, and persist under particular environmental conditions. These models encompass a range of approaches, from physiologically based models that explicitly simulate processes such as energy balance, water balance, development, and reproduction (e.g. NicheMapR), to semi-mechanistic models that represent species responses through simplified growth and stress functions informed by experimental or observational data. Because these models are based on the mechanisms that govern a species' response to its environment, they are generally considered better suited to estimating a species' fundamental distribution—that is, the geographic areas where environmental conditions are capable of supporting self-sustaining populations, irrespective of whether the species has dispersed there or whether its realised distribution is constrained by factors such as competition, predation, dispersal limitation, or other biotic interactions. Consequently, they are assumed to be more robust when extrapolating to novel environments or future climates. However, they require detailed experimental or physiological data that are unavailable for most invasive species, making them considerably more time-consuming and difficult to parameterise (Briscoe et al. 2019).
SDMs supported by Biosecurity Commons
Biosecurity Commons currently supports correlative species distribution models (SDMs) that are specifically suited to invasive species applications. In particular, the platform provides integrated support for two profile modelling approaches that estimate a species' environmental niche using occurrence records alone:
- Range Bagging – a presence-only ensemble environmental envelope approach.
- Climatch – a climate similarity approach that compares the environmental conditions at known occurrence locations with those at candidate locations.
Users interested in a broader range of SDM algorithms can instead use our sister platform, EcoCommons, which supports 16 modelling approaches (including Maxent, Generalised Additive Models, Generalised Linear Models, Boosted Regression Trees and others).
Many of the algorithms implemented in EcoCommons are two-class (discrimination) models that distinguish suitable from unsuitable environments by contrasting presence records with absence, pseudo-absence, or background locations. While these methods can perform well in many ecological applications, they require users to make important assumptions about the extent, availability, and distribution of pseudo-absence or background data. These assumptions are often difficult to justify for invasive species, whose realised distributions are typically incomplete because populations are still spreading, have not reached equilibrium, or remain undetected across large parts of their potential range. Consequently, predictions from two-class models can be sensitive to pseudo-absence or background selection, making outputs less robust and less directly comparable across species. For this reason, Biosecurity Commons focuses on profile-based methods that avoid these assumptions and are generally better aligned with the challenges of invasive species risk assessment.
Users wishing to incorporate other SDM algorithms into Biosecurity Commons can do so by first fitting their model in EcoCommons (or locally), exporting the resulting suitability map, and then uploading that output into the relevant Biosecurity Commons workflow (e.g. risk mapping, spread modelling, surveillance design, or impact assessment). This approach allows users to leverage the broader range of modelling algorithms available in EcoCommons while taking advantage of the downstream analytical and decision-support capabilities provided by Biosecurity Commons.
Random Seed
Setting a random seed ensures that the random sampling used by Range Bagging or Climatch is reproducible. Using the same input data, model parameters, and random seed will always produce identical results, making analyses easier to reproduce, validate, compare, and share with collaborators. In most cases, the default seed is appropriate and does not need to be changed unless a different random realisation is specifically required.
Range Bagging
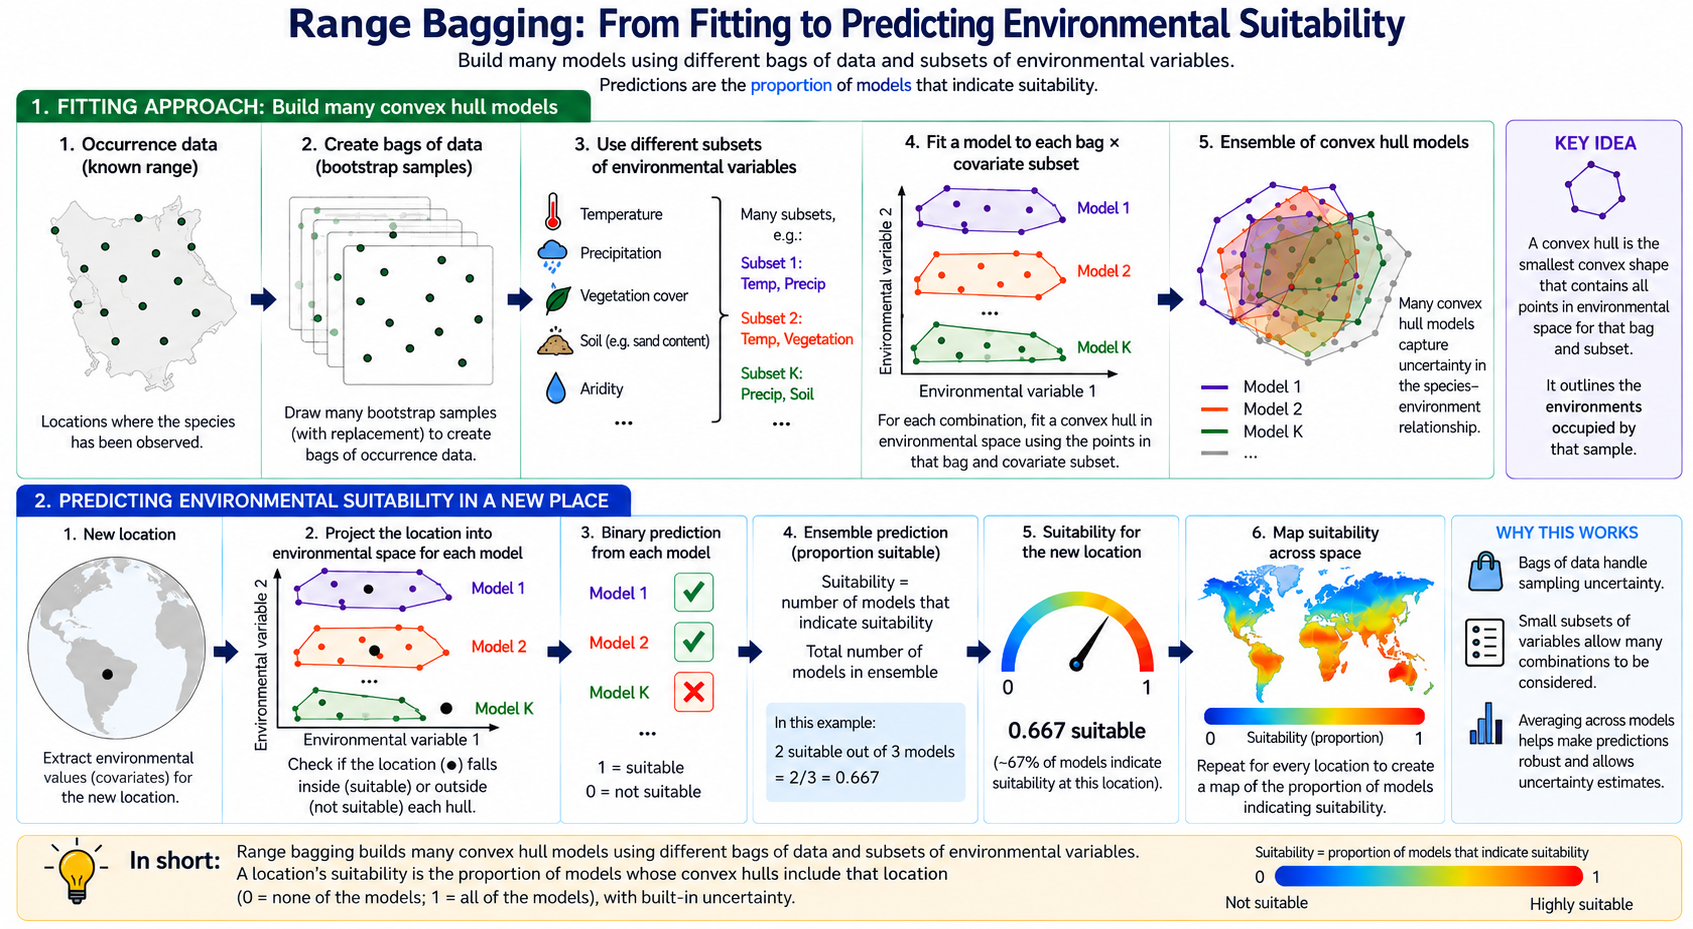
Range bagging (Drake 2015) is a presence-only species distribution modelling approach that estimates the environmental envelope occupied by a species from its known occurrence records. The underlying premise is that locations with environmental conditions similar to those occupied by the species are also likely to be capable of supporting establishment. To estimate this environmental envelope, the method repeatedly fits many simple models using random subsets of occurrence records and environmental variables. Each model defines the occupied environmental space using a multidimensional boundary (a convex hull), and locations whose environmental conditions fall within this boundary are classified as suitable. The final prediction is obtained by combining the results from all models, with suitability expressed as the proportion of models that classify a location as suitable. This ensemble approach reduces sensitivity to individual occurrence records and predictor variables while providing an intuitive measure of confidence in environmental suitability.
Range bagging is particularly well suited to biosecurity contexts because the primary objective is often to identify where an introduced species could establish if introduced, rather than simply defining its current distribution. By estimating the environmental envelope occupied by a species, the method provides a biologically intuitive estimate of potential establishment risk using only occurrence records. Unlike many other correlative methods, it does not require absence or background data, avoiding several subjective modelling decisions that can substantially influence model predictions.
Range Bagging Parameters
Number of dimensions (Default = 2):
The number of environmental covariates randomly selected for each individual model fit. We recommend retaining the default value of 2, meaning each model is fitted using only two environmental variables. Evidence suggests that ensembles of many simple bivariate models often produce more robust and transferable estimates of environmental suitability than fewer, more complex high-dimensional models. Restricting the dimensionality also reduces the risk of overfitting and allows the ensemble to better account for uncertainty in predictor selection.
Number of models (Default = 1000):
The number of bootstrap models included in the ensemble. Larger numbers improve the stability and precision of suitability estimates by more thoroughly sampling different combinations of occurrence records and environmental covariates. In most applications, 1000 models provides a good balance between computational efficiency and prediction stability, and is sufficient to adequately represent the uncertainty associated with the modelling process.
Proportion of occurrence records sampled for each model (Default = 0.5):
The proportion of occurrence records randomly sampled (with replacement) to construct the convex hull for each model. This parameter controls the degree of variation among ensemble members. There is currently little empirical evidence supporting a universally optimal value because the appropriate proportion depends on the size and quality of the occurrence dataset. A value of 0.5 is generally suitable for large datasets containing hundreds or thousands of records. For smaller datasets (e.g. fewer than 100 occurrence records), higher values are recommended to ensure each bootstrap sample contains sufficient data to estimate a meaningful environmental envelope.
Limit occurrence records (Default = TRUE):
When enabled, each occurrence record can contribute only once to an individual bootstrap sample, even though sampling is performed with replacement. We strongly recommend leaving this option enabled. Doing so reduces the influence of duplicated records within individual models, helps minimise the effects of spatial sampling bias, and produces more representative estimates of the occupied environmental envelope.
Spatial cross-validation (Default = off):
When enabled, occurrence records are partitioned into five spatial folds and Range Bagging is evaluated with an out-of-sample Boyce index. Block width is chosen automatically. See Evaluating model performance. Each fold model is predicted only to the held-out records and the grid cells in the held-out blocks, and the suitability map is still produced once, so the added run time is negligible. Range Bagging still writes a full-model Boyce index when the option is left off. That full-model index describes fit to the training records. Enable spatial cross-validation when you need a check on held-out geography.
Range Bagging Advantages
- Estimates the occupied environmental envelope of a species, making it particularly well suited to identifying areas at risk of establishment during pre-border preparedness, horizon scanning, and early post-border surveillance.
- Does not require absence or pseudo-absence (background) data, avoiding a major source of bias and uncertainty in invasive species modelling.
- Fits large ensembles of simple, low-dimensional models (using small random subsets of environmental variables), an approach that has been shown to reduce overfitting and often provides more robust predictions than fitting a single complex model.
- Explicitly accounts for uncertainty in predictor selection by repeatedly fitting models using different subsets of environmental variables, reducing dependence on any single set of covariates.
- Reduces overfitting and improves generalisation by combining predictions across bootstrap samples of occurrence records and environmental variables, producing robust estimates of environmental suitability that are less sensitive to sampling noise.
- Produces suitability scores that are directly comparable across species, as predictions represent the proportion of ensemble models identifying a location as environmentally suitable.
- Provides intuitive outputs that are easy to interpret, with higher values indicating greater agreement among ensemble models that environmental conditions are suitable.
- Is relatively insensitive to spatial sampling bias compared with discrimination-based approaches because it characterises the occupied environmental envelope rather than contrasting presences against background locations.
- Is computationally efficient and straightforward to parameterise, making it well suited to rapid screening and comparative assessment of large numbers of species.
Range Bagging Limitations
- Restricted to continuous environmental variables because convex hulls cannot readily accommodate categorical predictors.
- Represents environmental limits using broad environmental envelopes and may therefore smooth abrupt ecological thresholds (e.g. frost tolerance or critical temperature limits), potentially overestimating suitability near the edge of a species' environmental niche.
- Assumes that occurrence records adequately characterise the occupied environmental envelope. Sparse or environmentally biased occurrence datasets may therefore underestimate the full range of suitable environmental conditions.
- Like all correlative models, predictions are based on observed environmental associations rather than the biological processes that determine species persistence. Consequently, predictions should be interpreted cautiously when extrapolating to novel environments or future climates.
Climatch
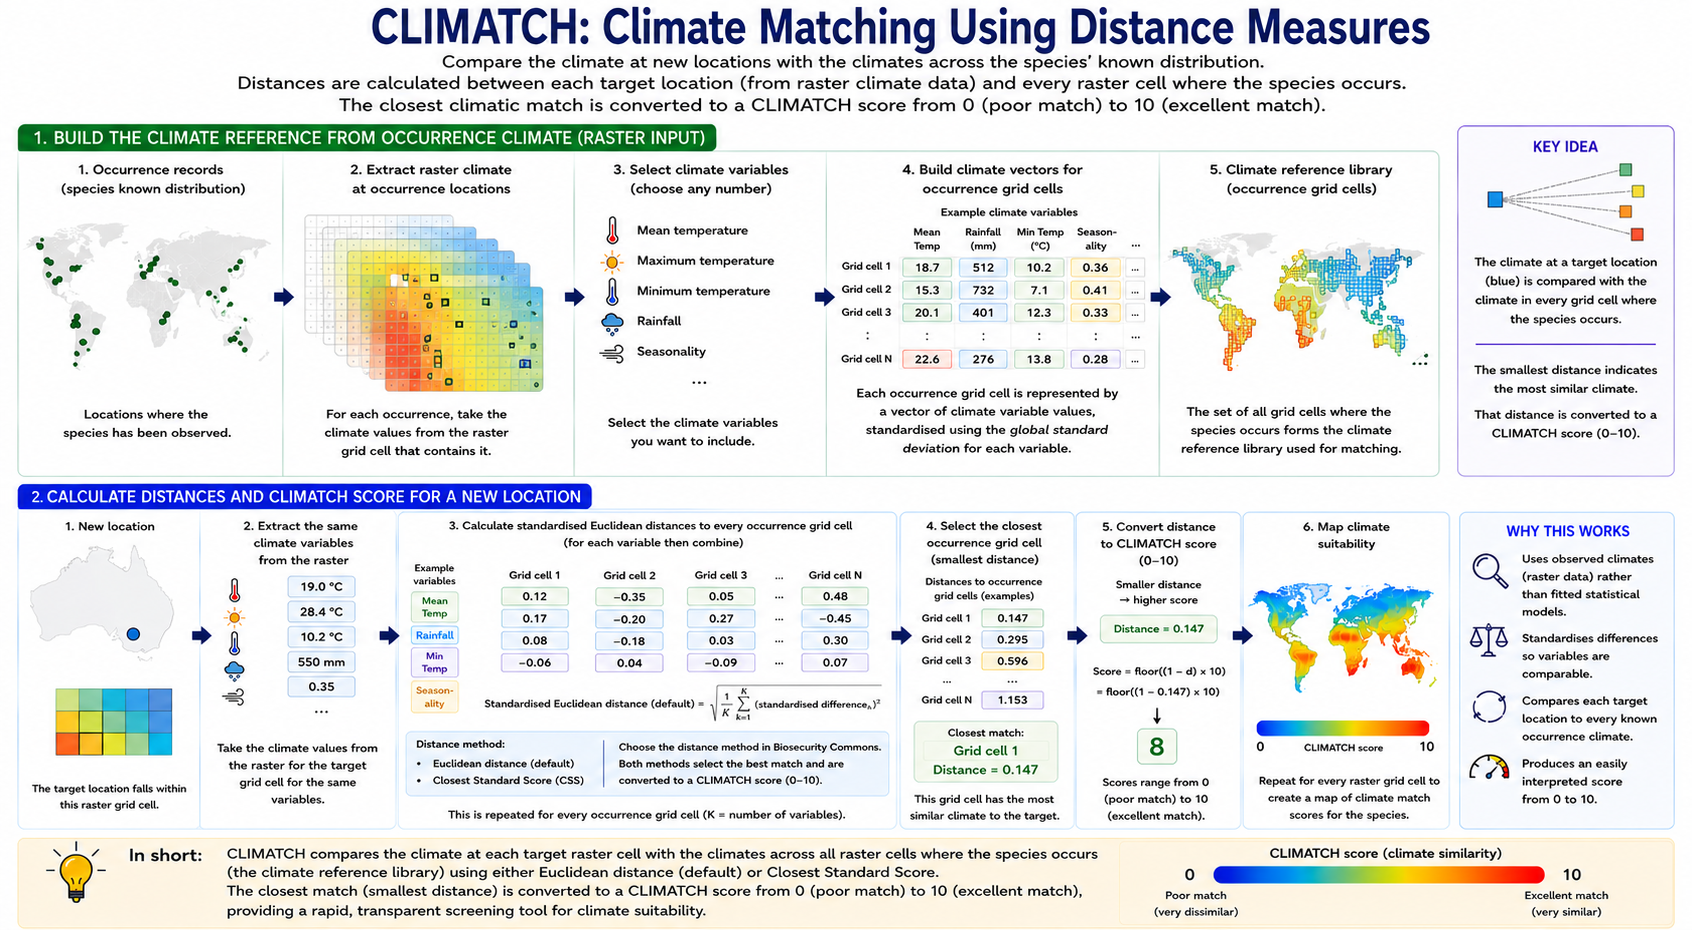
Climatch (Crombie et al. 2008; ABARES 2020) is a climate-matching approach that identifies locations with climatic conditions similar to those observed across a species' known distribution. Rather than fitting a statistical model, Climatch compares the climate at every location in a target landscape with the climates recorded at known occurrence locations. Each climatic variable (e.g. annual rainfall, maximum temperature, or minimum temperature) represents a separate dimension in environmental space, allowing each location to be described by its unique combination of climatic conditions. For every target location, differences in these climatic variables relative to each occurrence location are first standardised to account for differences in scale among variables. Climatic similarity is then calculated using one of two alternative algorithms that combine these standardised differences to produce an overall measure of climatic similarity.
For each target location, Climatch identifies the occurrence location with the most similar climate according to the selected matching algorithm and assigns a climatic similarity score, with higher values indicating climates that more closely resemble those experienced by the species. Because Climatch relies solely on presence records and direct comparisons of climate, it does not require absence or background data, nor does it involve fitting complex statistical relationships. This makes the method transparent, computationally efficient, and well suited to rapid horizon scanning and preliminary assessments of establishment risk.
Unlike Range Bagging, which estimates the occupied environmental envelope of a species by identifying the range of environmental conditions associated with known occurrence records, Climatch identifies locations whose climates most closely resemble those already occupied by the species. Climatch therefore measures climatic similarity rather than estimating a species' environmental limits or environmental suitability. Consequently, it is best regarded as a climate analogue method for rapid screening, whereas Range Bagging provides a more robust estimate of environmental suitability and is generally preferred when sufficient occurrence data are available.
CLIMATCH Parameters
Maximum range distance (Default = 50 km)
The maximum distance (km) used to associate each occurrence record with the nearest climate data point (weather station or raster cell). Occurrence records located further than this distance from a valid climate data point are excluded from the analysis. This parameter is primarily intended to accommodate small spatial mismatches between occurrence locations and climate datasets (e.g. differences in coastline position, raster resolution, or coordinate precision).
For most applications, the default value of 50 km is appropriate and should not require modification. Larger values may be appropriate when using coarse-resolution climate datasets or occurrence records with lower spatial accuracy, whereas smaller values may be preferable when working with high-resolution climate data and precisely georeferenced records.
Climatch algorithm (Default = Euclidean)
The algorithm used to calculate climatic similarity between occurrence locations and the target landscape.
Two algorithms are available:
Euclidean (recommended):
Calculates the standardised Euclidean distance between the climate at each target location and every occurrence location across all selected climatic variables. Climatic differences are averaged across variables to produce an overall measure of climatic similarity, and the occurrence location with the smallest overall distance is used to derive the final Climatch score. Because all climatic variables contribute equally to the final score, this method provides a balanced assessment of overall climatic similarity and is recommended for most biosecurity applications.
Closest Standard Score (CSS):
Calculates the standardised difference for each climatic variable separately and assigns each difference to one of ten decile classes based on a half-normal distribution. For each occurrence location, the algorithm identifies the worst-matching climatic variable (the highest decile score). The final Climatch score is then based on the occurrence location whose worst-matching climatic variable is least dissimilar to the target location (a "max-then-min" approach). Consequently, climatic similarity is determined by the single climatic variable that differs most between locations, rather than by the average difference across all climatic variables.
For most biosecurity applications we recommend using the default Euclidean algorithm because it provides a balanced measure of overall climatic similarity. The Closest Standard Score algorithm may be useful when users wish to place greater emphasis on limiting climatic factors or reproduce analyses performed using historical Climatch implementations.
Logical checkbox: Output as 0–1 instead of 0–10
By default, Climatch produces climate match scores ranging from 0 (poor climatic match) to 10 (excellent climatic match). Enabling this option linearly rescales the output to a 0–1 range, making it more convenient for use as a relative suitability layer in downstream workflows, such as the abiotic suitability component of the establishment potential workflow. Note that the rescaled values represent relative suitability, not absolute probabilities of establishment.
Spatial cross-validation (Default = off):
When enabled, occurrence records are partitioned into five spatial folds and Climatch is evaluated with an out-of-sample Boyce index. Boyce outputs are written when this option is enabled. See Evaluating model performance. Training locations receive the maximum Climatch score, so the cross-validated index is the performance measure Climatch reports. Each fold is scored only on the held-out locations and the cells in the held-out blocks, so the added run time is negligible.
CLIMATCH Advantages
- Does not require absence or pseudo-absence (background) data, avoiding a major source of bias and uncertainty in invasive species modelling.
- Can be applied when relatively few occurrence records are available, making it useful for newly emerging invasive species where distribution data are sparse.
- Rapidly identifies regions with climates analogous to those occupied by the species, making it well suited to horizon scanning, pre-border preparedness, and preliminary establishment risk assessments.
- Produces climatic similarity scores that are directly comparable across species, facilitating consistent screening and prioritisation of multiple invasive threats.
- Computationally efficient and straightforward to parameterise, requiring only occurrence records and climatic variables.
- Produces transparent and intuitive outputs because predictions are based on direct comparisons of climatic similarity rather than fitted statistical relationships.
CLIMATCH Limitations
- Measures climatic similarity rather than estimating a species' occupied environmental niche or environmental suitability, so outputs should not be interpreted as probabilities of establishment.
- Does not account for uncertainty in predictor selection, as predictions are based on a single user-defined set of climatic variables rather than an ensemble of alternative predictor combinations.
- Does not explicitly model interactions or nonlinear relationships among climatic variables, potentially limiting its ability to represent complex ecological responses.
- Restricted to continuous climatic variables and cannot directly incorporate categorical predictors such as land use or vegetation classes.
- Generally less suitable for fine-scale ecological modelling or estimating environmental limits than methods such as Range Bagging that explicitly characterise a species' occupied environmental envelope.
The importance of filtering & cleaning occurrence records
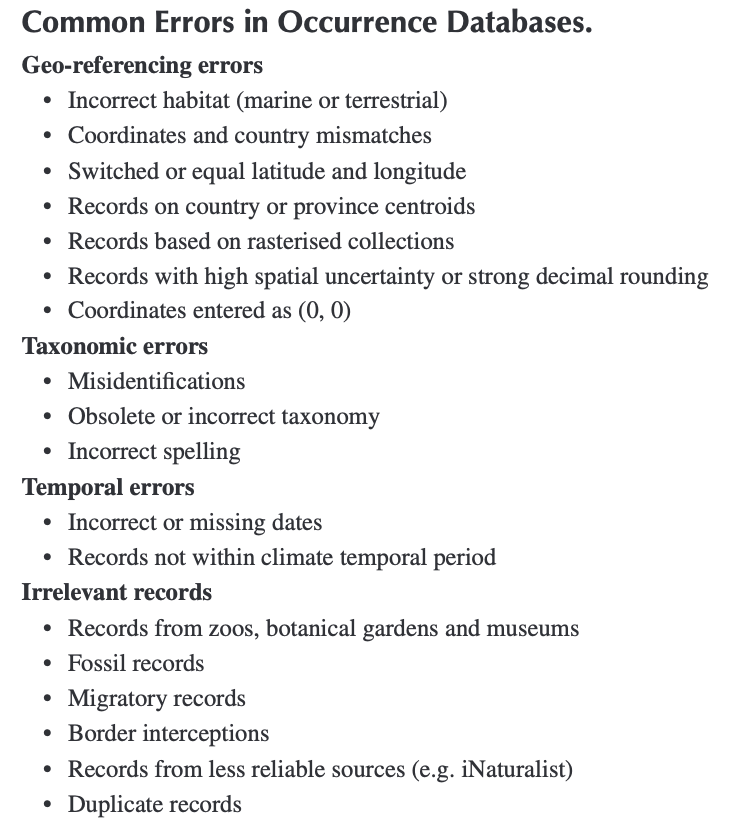
The accuracy of a correlative SDM depends on the quality of input occurrence records. Biosecurity Commons allows users to upload their own occurrence records or use our integrated APIs to pull records from biodiversity databases such as the Global Biodiversity Information Facility (GBIF), Atlas of Living Australia (ALA) or Ocean Biodiversity Information System (OBIS). Occurrence records from online databases like the GBIF often contain errors that can introduce significant bias (Camac et al. 2024).
Importing and filtering occurrence records
When pulling records from such databases, users have multiple options for filtering records. Specifically there are a range of filtering options for improving the quality of occurrence datasets prior to modelling by removing records that are unlikely to represent established populations or that are incompatible with the selected environmental data. Records can be filtered by occurrence status, record type (e.g. observation or preserved specimen), collection date, and geographic location. Users can also exclude records without geographic coordinates and restrict analyses to countries where the species is known to be established, helping to remove transient, introduced, or erroneous records. Cross-referencing occurrence records against authoritative distribution datasets, such as CABI's Invasive Species Compendium, is particularly useful for identifying countries where a species is known to have established populations and excluding records from countries where occurrences are likely to represent interceptions, failed introductions, or other transient observations. Aligning the temporal range of occurrence records with the environmental datasets used for modelling (e.g. post-1970 records when using WorldClim 2.1) is also recommended to improve consistency between species observations and the environmental conditions represented by the predictor variables.
Additional cleaning of records
Biosecurity Commons also provides a suite of automated occurrence-cleaning routines that complement the import filters described above. These routines are based on the R package CoordinateCleaner and are designed to identify and remove common georeferencing errors and artefacts frequently found in biodiversity databases. Eliminating these erroneous records helps improve the quality of occurrence datasets and reduces the likelihood of fitting models to locations that do not represent genuine species occurrences.
The following cleaning routines are available:
- Capital centroids: Removes records located within a user-defined radius (default: 5000m) of national or state capital centroids, which often indicate imprecisely georeferenced records.
- Country centroids: Removes records located within a user-defined radius (default: 5000m) of country centroids, which are commonly assigned when precise collection locations are unavailable.
- Equal coordinates: Removes records where latitude and longitude are identical, a common data-entry error (e.g. 35°, 35°).
- Biodiversity institutions: Removes records located within a user-defined radius (default: 100m) of known biodiversity institutions (e.g. museums, herbaria, universities, botanical gardens), where specimen storage locations may have been mistakenly recorded instead of collection locations.
- GBIF headquarters: Removes records located within one degree of the GBIF headquarters in Copenhagen, Denmark, which are typically artefacts of data processing rather than true species occurrences.
- Zero coordinates: Removes records located at, or within a user-defined radius (0.5 degrees) of the coordinate origin (0°, 0°), a well-known placeholder for missing geographic coordinates.
- Sea locations: Removes terrestrial occurrence records located in marine environments, helping identify records with erroneous coordinates or georeferencing errors.
Importance of expert review (Gold standard)
Filtering and automated cleaning routines are designed to identify common errors and artefacts in biodiversity datasets, but they cannot determine whether an individual occurrence record is biologically plausible. Where feasible, the cleaned dataset should be reviewed by subject-matter experts to identify remaining issues such as misidentified specimens, transient or intercepted records, spatial outliers, coordinate errors, or records from regions where the species is not known to have established populations. Expert review provides an important final quality-assurance step, helping ensure that occurrence records accurately represent the species' occupied distribution before model fitting.
Selecting model covariates
The choice of environmental covariates is one of the most important—and often most challenging—aspects of species distribution modelling (Camac et al. 2024). At broad spatial scales (e.g. continental or global analyses), climate is generally the dominant determinant of species distributions and therefore forms the basis of most biosecurity risk assessments. At finer spatial scales, however, additional environmental factors such as host availability, land use, topography, soils, or vegetation may further influence whether a species can establish and persist.
Biosecurity Commons supports a wide range of environmental datasets, allowing users to tailor predictor variables to the ecology of the species being modelled. Commonly used datasets include:
- WorldClim: The most widely used environmental dataset for species distribution modelling, providing 19 biologically meaningful (BIOCLIM) variables describing long-term patterns in temperature and precipitation (e.g. Annual Mean Temperature, Temperature Seasonality, Annual Precipitation and Precipitation of the Warmest Quarter) at spatial resolutions as fine as approximately 1 km.
- CHELSA: High-resolution climate surfaces that explicitly account for topographic effects and may provide improved estimates of climate in mountainous regions.
- CliMond: Global climate datasets that include historical climate surfaces and future climate projections.
- Climate Research Unit (CRU): Monthly climate datasets that can be useful for generating custom climatic summaries or temporal analyses.
- Non-climatic datasets: Additional predictors such as elevation, terrain derivatives (e.g. slope or aspect), soils, land use, vegetation, or host distributions can be incorporated where these factors are expected to influence establishment or persistence.
Selecting multiple predictor datasets & common resolution
Biosecurity Commons allows users to combine multiple predictor datasets, which may have different spatial resolutions. To ensure all continuous predictors align, datasets are automatically resampled to a common grid. Users can choose whether this common resolution matches the finest (smallest grid cells) or coarsest (largest grid cells) input dataset. Irrespective of method chosen, Biosecurity Commons will utilise bilinear interpolation to resample predictor inputs to a common resolution/grid.
Selecting predictor variables
Selecting an appropriate set of predictor variables requires careful consideration of both the species' biology and the modelling approach. Although datasets such as WorldClim provide 19 BIOCLIM variables, many describe similar aspects of climate and are therefore highly correlated. Including large numbers of correlated or biologically irrelevant variables may increase model complexity without improving predictive performance and can make model interpretation more difficult. Where possible, predictor variables should be selected a priori based on ecological knowledge of the species, ensuring they represent environmental factors likely to influence survival, growth, reproduction, or persistence.
For most continental-scale biosecurity applications, we recommend using the WorldClim BIOCLIM variables as a starting point because they are widely used, well validated, and facilitate comparison among studies. However, the optimal subset of variables will differ among species and applications, and there is rarely a single objectively "correct" set of predictors.
Importantly, different modelling approaches vary in their sensitivity to predictor selection. Methods that fit a single model(e.g. Climatch or Maxent) require users to carefully select an appropriate set of environmental variables, as predictions depend entirely on that choice. In contrast, Range Bagging explicitly accounts for uncertainty in predictor selection by repeatedly fitting large ensembles of low-dimensional models using random subsets of environmental variables, making predictions less dependent on any single combination of covariates.
Assessing extrapolation and environmental novelty
Species distribution models are generally most reliable when making predictions within the range of environmental conditions represented by the occurrence records used to fit the model. Predictions become increasingly uncertain when projected into environments that differ substantially from those represented in the training data, as the model must extrapolate beyond the environmental conditions on which it was developed. This commonly occurs when projecting models to new geographic regions, future climates, or when occurrence records do not adequately capture the full environmental range occupied by the species.
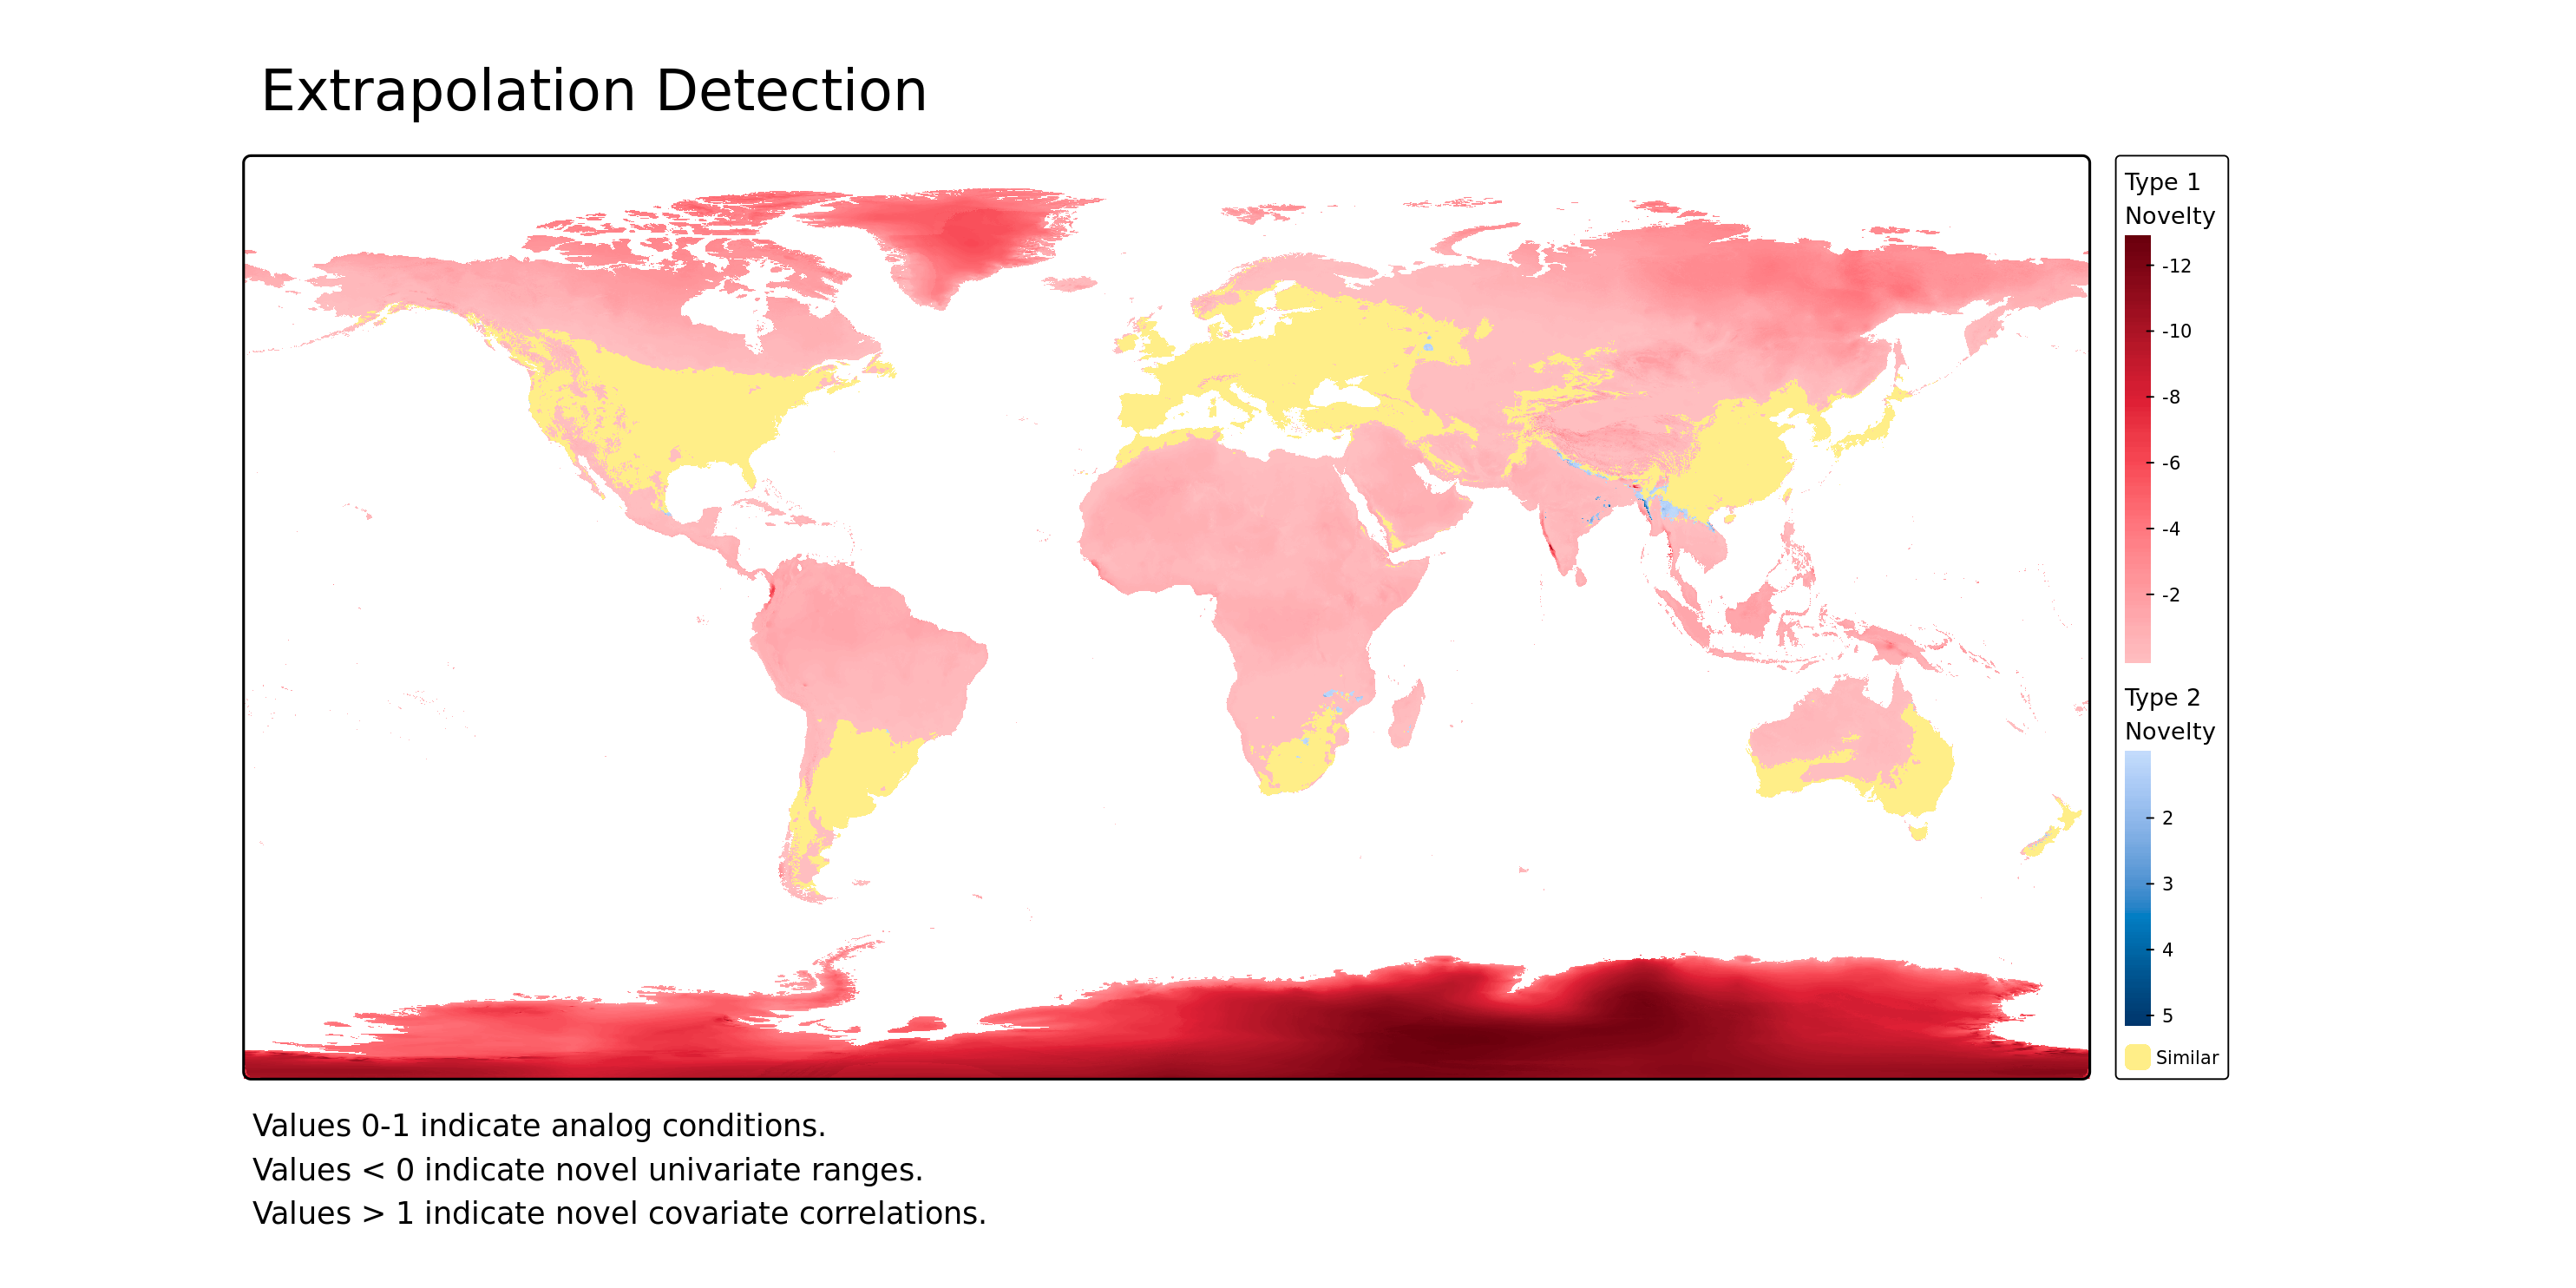
Environmental novelty can arise in two ways. First, one or more environmental variables may fall outside the range observed during model fitting (Type 1 novelty). Second, all environmental variables may individually lie within their observed ranges but occur in combinations that were not represented in the training data (Type 2 novelty). Both forms of novelty reduce confidence that model predictions are supported by observed data and should therefore be considered when interpreting suitability maps.
To help identify areas where extrapolation occurs, Biosecurity Commons provides two complementary diagnostic methods: MESS (Multivariate Environmental Similarity Surface) (Elith et al. 2010) and ExDet (Extrapolation Detection) (Mesgaran et al. 2014). Together, these methods enable users to identify where predictions are supported by environmental conditions represented in the occurrence data, and where they rely on extrapolation into novel environmental space.
MESS (Multivariate Environmental Similarity Surface)
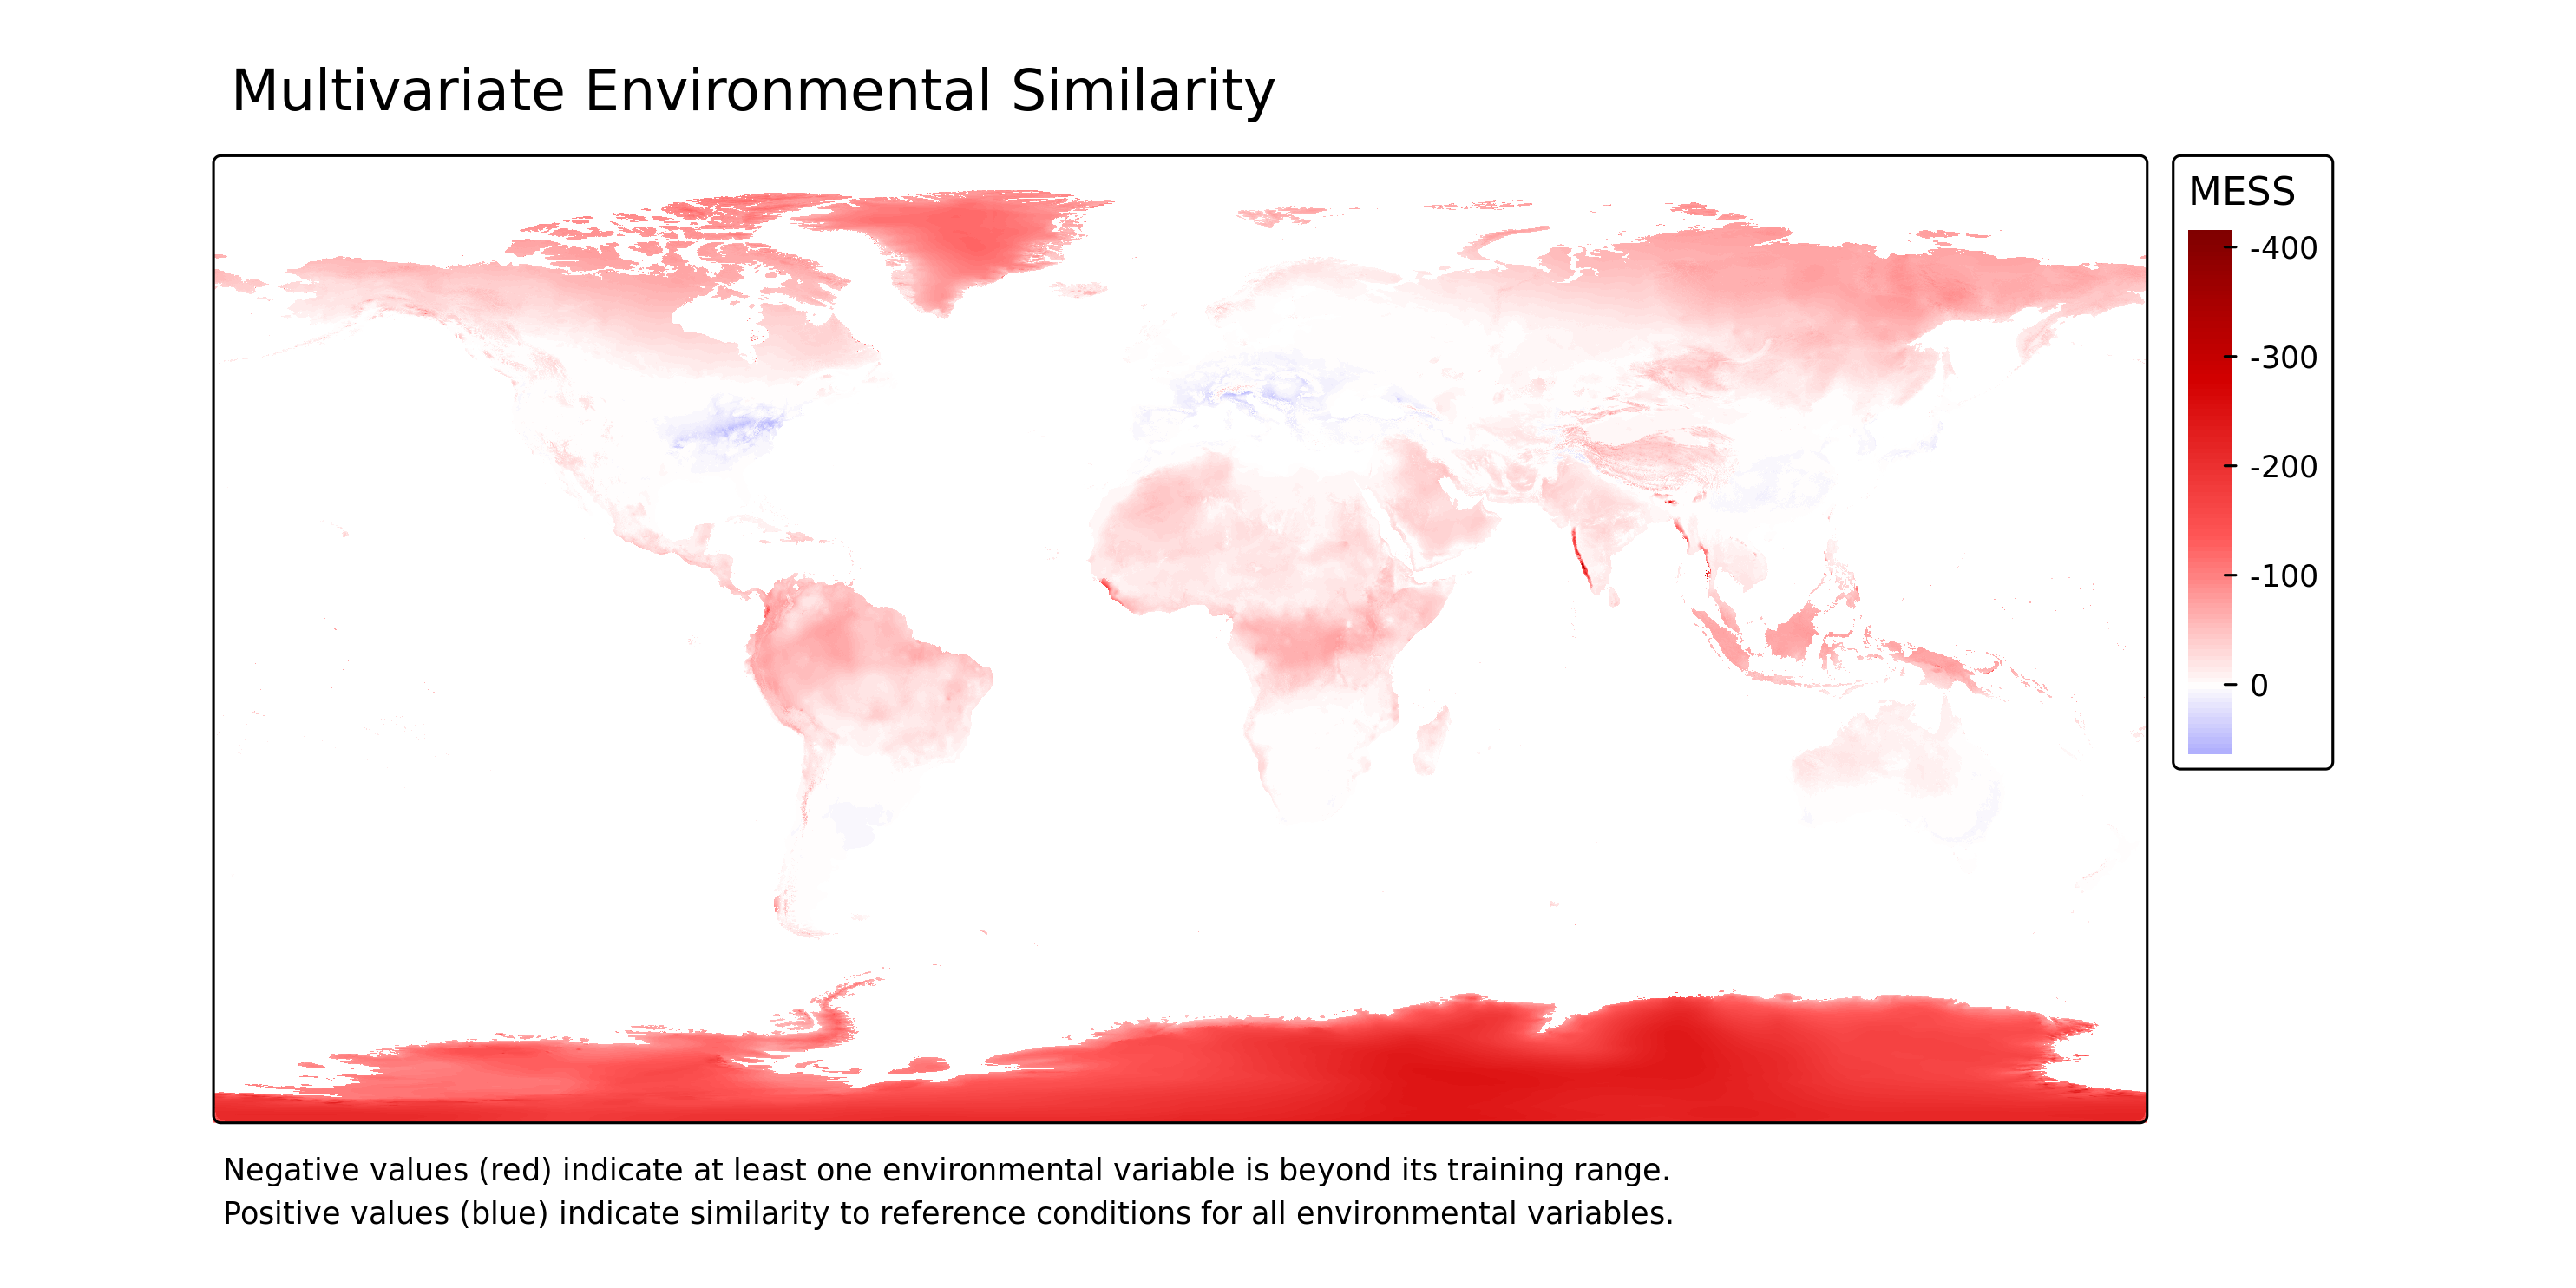
MESS (Elith et al. 2010) quantifies how similar the environmental conditions at each prediction location are to those represented by the occurrence records used to fit the model.
- MESS > 0: All environmental variables fall within the range represented by the training data, indicating predictions are being made within the observed environmental domain.
- MESS < 0: At least one environmental variable falls outside its observed range, indicating extrapolation into novel environmental conditions.
In addition to the MESS similarity map, Biosecurity Commons produces a companion raster identifying the environmental variable contributing most strongly to the MESS score at each location. This helps users identify which environmental variable is primarily responsible for environmental novelty.
ExDet (Extrapolation Detection)
ExDet (Mesgaran et al. 2014) provides a more comprehensive assessment of extrapolation by identifying both the presence and the type of environmental novelty.
- ExDet ≥ 0: Environmental conditions fall within the environmental space represented by the training data.
- ExDet < 0: Environmental conditions exhibit extrapolation into novel environmental space.
Unlike MESS, ExDet distinguishes between two forms of environmental novelty:
- Type 1 novelty (NT1; univariate novelty): One or more environmental variables fall outside the range observed during model fitting.
- Type 2 novelty (NT2; combinatorial novelty): All environmental variables individually fall within their observed ranges, but occur in combinations that were not represented in the training data.
Biosecurity Commons produces an overall ExDet map identifying the dominant form of environmental novelty at each location, together with companion rasters identifying the environmental variable contributing most strongly to Type 1 and Type 2 novelty. These outputs help users determine not only where extrapolation occurs, but also which environmental variables are responsible.
All extrapolation outputs are provided as georeferenced GeoTIFF rasters suitable for further spatial analysis, together with publication-quality PNG images for rapid visual interpretation.
Interpreting extrapolation
Environmental novelty does not necessarily indicate that model predictions are incorrect. Rather, it identifies locations where predictions rely on extrapolation beyond the environmental conditions represented in the occurrence data and should therefore be interpreted with greater caution. Areas exhibiting extensive Type 1 or Type 2 novelty indicate that model predictions are less well supported by the available occurrence data and may warrant additional occurrence records, alternative modelling approaches, or independent validation before being used to support management or policy decisions.
Evaluating model performance
A suitability map shows where a model considers the environment favourable. Biosecurity Commons also reports how well that pattern agrees with known occurrences, using the Boyce index (Hirzel et al. 2006). An optional spatial cross-validation repeats the test on records held out in geographic blocks (Roberts et al. 2017; Valavi et al. 2019). Range Bagging always writes Boyce products, including interpretation.md, a short run-specific guide to those scores. Climatch writes Boyce products, including that guide, only when spatial cross-validation is enabled (see Interpreting Boyce outputs).
These diagnostics answer a different question from MESS and ExDet. The Boyce index describes agreement between predicted suitability and known occurrences in the area used to calculate the index. MESS and ExDet describe where the mapped prediction moves into environmental conditions that were absent from the occurrence data. A strong Boyce index can sit alongside extensive novelty elsewhere on the map, so read the two sets of outputs together.
Boyce index
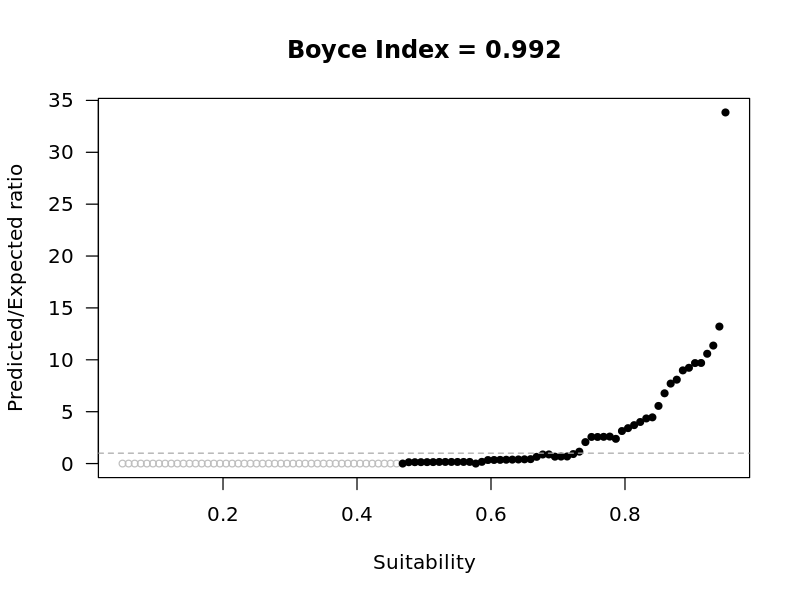
The Boyce index compares suitability at presence locations with suitability across the area being evaluated. Suitability is divided into classes. For each class the method calculates a predicted-to-expected (P/E) ratio: the proportion of presence records falling in that class, divided by the proportion of the evaluated area falling in that class. A P/E ratio above 1 means presences are more common in that class than the area alone would suggest. A ratio below 1 means they are less common. A ratio of 1 (indicated by the dashed horizontal line) indicates that presences fall into the focal class in proportion to the availability of that class (i.e., equivalent to random spatial distribution).
The Boyce index is the Spearman rank correlation between class suitability and the P/E ratio. It ranges from −1 to 1.
- Positive values, closer to 1, indicate that occurrences are concentrated in higher-suitability classes. The model's ranking of the landscape agrees with where the species has been recorded.
- Values near zero indicate that occurrences are distributed across suitability classes in much the same way as the evaluated area. Agreement is similar to assigning locations at random within that area.
- Negative values indicate that occurrences are concentrated in lower-suitability classes. Recorded locations are ranked as less suitable than the surrounding area.
There is no universal cutoff that separates an acceptable model from a poor one. Interpret the index together with the shape of the P/E curve, the spread of values across cross-validation folds, and the species and region being assessed. A low or negative index is a reason to revisit occurrence cleaning, predictor choice, and the choice of algorithm before the map is used in a decision.
The index can also give a misleadingly low score when the map is right. It compares recorded occurrences with the amount of predicted suitable habitat. Large areas predicted as highly suitable but containing few recorded occurrences lower the predicted-to-expected ratio in those classes, and can pull the index down, even when those areas are genuinely suitable and the records are simply sparse or incomplete. That situation is common for invasive species that have not yet filled their potential range: a region may contain many highly suitable cells that are still unoccupied because the invasion is recent or spreading. Under spatial cross-validation, a fold whose held-out blocks fall in such a region can score poorly for the same reason, even when the model correctly identifies those cells as suitable.
For Range Bagging, suitability is continuous, so the index uses a moving window across the suitability range: a window one tenth of the range wide, evaluated at 100 positions. This is the continuous Boyce index, following the implementation in the ecospat package (Broennimann et al. 2025). Each position of that window is a suitability class. Successive classes with the same predicted-to-expected ratio are left out of the correlation (shown as hollow grey points in the figure below), so a flat stretch of the curve does not dominate the result.
The figure below is the full-model Boyce plot from a Range Bagging run for Lecanosticta acicola. The index is 0.992. The predicted-to-expected ratio stays near zero through the lower suitability classes and then rises steeply, so the known occurrences are concentrated in the most suitable classes. Filled black points are the classes used to calculate the Boyce index. The dashed line is a predicted-to-expected ratio of 1. This plot scores the model on the records used to fit it. It is not the cross-validated estimate.
For Climatch, scores take a fixed set of values, so the index uses one class per score. With the default 0–10 scores, each integer score is its own class, and class boundaries sit halfway between integers so each score falls in a single class. When scores are rescaled to 0–1, the classes are ten equal intervals across that range. Fixed classes match the discrete scores. A moving window would revisit the same few score values many times.
Range Bagging always produces a full-model Boyce index. It uses every occurrence record that entered the model, and compares those records with suitability across the prediction map. The index describes fit to the training records. Nearby records often share similar environments, so this value can look stronger than the same model will look when applied in a new region.
Climatch matches each training location to the occurrence climate closest to itself, so every training location receives the maximum score. A Boyce index calculated on those locations equals 1 for any set of predictors, and would do so whatever climate data were used. Climatch therefore reports a Boyce index only when spatial cross-validation is turned on. Each fold score comes from a refit that has not been shown the held-out locations.
Cross-validation
Spatial cross-validation assesses how well a model predicts occurrences in geographic areas excluded from model fitting. This is particularly useful in biosecurity, where prediction maps are used to anticipate establishment in areas an invasive species has not yet reached. Withholding geographically distinct groups of records provides a more realistic test of transfer to new locations than randomly withholding records, which may leave nearby records with similar environmental conditions in both the fitting and evaluation sets.
The records are divided into geographic groups, called folds. Each fold is withheld in turn, the model is refitted using the remaining folds, and its predictions are evaluated against the withheld records. This produces one score per fold.
By contrast, evaluating a model using the same records used to fit it can overstate its performance on unseen records. The full-model Boyce index uses these fitting records; for Climatch, it equals 1 regardless of the predictors selected.
Because uninvaded areas lack occurrence records, predictions of suitability in these areas cannot be validated directly when the map is produced (Jiménez-Valverde et al. 2011). A spatially cross-validated Boyce index provides a practical proxy by testing predictions against known occurrences in geographically distinct areas excluded from model fitting. However, these records still represent places the species has already reached, and may not capture the environmental conditions or constraints on establishment in uninvaded areas.
Spatial cross-validation is therefore useful for interrogating the model, rather than confirming its predictions in uninvaded areas. Comparing scores across folds can reveal where predictions agree less well with withheld occurrences and prompt investigation of environmental differences, gaps in the occurrence data or sensitivity to the regions used for fitting. It can also help assess whether alternative predictor sets produce more consistent performance across withheld regions. Strong performance supports confidence in transfer under conditions represented by those tests, but does not establish reliability under novel conditions.
Biosecurity Commons runs this check as spatial block cross-validation, and the score on each fold is a Boyce index. The withheld groups are blocks of nearby records. Occurrence records are usually clustered in space, and nearby locations tend to share similar environments. Withholding a block withholds those neighbours together, so a held-out location is less likely to have a close neighbour still in the fitting data. The blocks, usually many more than five, are assigned at random to five folds, so each fold is a group of blocks. One fold is withheld at a time, the model is refitted on the other four, and the Boyce index uses the held-out records and the cells inside the held-out blocks. A positive score indicates that the pattern fitted to the other records has been recovered inside the blocks that were left out. Where that result repeats across folds, a model fitted to part of the known records still recovers the pattern in other blocks of the known range. The scores come from those refits, each with one fold hidden. The final SDM prediction map is fitted to every record, so the cross-validation describes how this sort of model behaves when part of the sampled range is hidden.
The average of those scores summarises the assessment (Roberts et al. 2017). A high average means the recovery of held-out records was repeated across the folds. A low or uneven set of scores is a reason to inspect the fold curves and the block map, as described below. The average on its own is not a reason to set the final prediction map aside.
The Boyce index is calculated from recorded occurrences, so it cannot grade places that have none. The folds therefore score blocks that already contain records. Where spread inside those blocks is still incomplete, broad areas of high suitability with few records pull the score down. A model that marks many unoccupied cells inside the held-out blocks as suitable can score worse than one that stays close to the cells that already have records. Those unoccupied cells are often the ones that matter for biosecurity preparedness.
Biosecurity Commons builds the blocks as hexagons with blockCV (Valavi et al. 2019). Those blocks are assigned to five folds by trying a series of random assignments and keeping the one in which the numbers of occurrence records differ least between folds. The search reduces that imbalance. Counts can still differ, because each block stays in one fold and only a limited number of assignments are tried. Adjacent blocks can still fall in different folds, so some spatial proximity between the fitting records and the held-out records can remain.
When Spatial cross-validation is enabled, both Range Bagging and Climatch do the following:
- Occurrence records are covered by hexagons. Hexagon width is chosen from the bounding box of the records, aiming for about ten blocks along the longer side. Blocks also tile the shorter side, so the total number of hexagons is greater than ten. The width is then adjusted within a limited range, so that no single block holds too large a share of the records, while blocks remain large relative to the predictor resolution and are not reduced to a small fraction of the area covered by the records. The selected width is a heuristic based on these characteristics. It is not an estimate of the distance beyond which spatial autocorrelation disappears. Adjacent blocks may therefore still contain spatially correlated records. The width used, in metres, is written to boyce.csv as block_size_m.
- Blocks are assigned to five folds by keeping the random assignment in which the fold record counts differ least.
- For each fold the model is refitted on the records in the other four folds.
- The Boyce index for that fold uses the held-out records as presences and the raster cells inside the held-out blocks as the area available for the P/E ratio. Cells outside those blocks are excluded from that fold's calculation. The fold score indicates whether the predicted-to-expected ratio rises with suitability inside those blocks. A positive index means held-out occurrences are concentrated in higher-suitability classes. A negative index means they are concentrated in lower-suitability classes. A value near zero indicates little consistent relationship between suitability and where the held-out occurrences fall.
The mean of the fold indices (cv_fold_mean) is the unweighted average of the fold scores, so each fold counts equally. Record counts can still differ after the balancing step above, and a fold with fewer records counts the same in the average as a fold with more. The standard deviation (cv_fold_sd) describes how much those scores vary between folds. A high mean with a small standard deviation means the held-out blocks were ranked in a similar way. A large standard deviation, or a mixture of positive and negative scores, means the result depends on which blocks are held out. These statistics describe variation across the five fold scores. They are not a formal confidence interval, and they do not capture uncertainty from the particular random assignment of blocks to folds.
When folds disagree, use the fold curves and the spatial block map together (see figures below). The map shows the geographic blocks pooled into a fold. The curve shows whether held-out occurrences tend to fall in lower-suitability classes than other cells in those blocks (a negative index) or show little consistent relationship with suitability (an index near zero). Because one curve covers every block in the fold, a poor score can come from one cluster of blocks or from several, and the curve does not separate them.
Ask next whether those blocks occupy a climate that the training records for that fold do not contain. Environmental novelty is relative to the data used to fit a particular model. A climate may be represented in the full occurrence dataset, and therefore familiar to the final model, while absent from the training records of one fold. In that case the fold is testing transfer into conditions the fold model has not encountered, and the final model is not. MESS and ExDet do not show this. They compare the prediction grid with the full occurrence set, so a climate missing from one fold but present in the others looks familiar on those maps. The block map shows where the fold's blocks are. Whether they sit outside the climates of the records that remained in that fold is a judgement from those locations and from the species' known climates. The platform does not map novelty separately for each fold.
The final prediction map can still be used for climates represented in the occurrence data, including the climate of a weak fold. If the final map gives high suitability to a climate that only the weak fold's records occupy, that suitability rests on those records alone. The other folds supply no separate support for it, because their records do not include that climate. Where the low score comes from that kind of novelty, it estimates how a model that has not seen those records would perform in that climate. Novelty of that sort is only one reason for a poor score. Differences in sampling, occurrence density and species-environment relationships between regions can also contribute. So can incomplete range filling. If the held-out blocks lie where an invasion has only just begun, many highly suitable cells may still be unoccupied, and the fold score can fall even when those predictions are correct. The index is then responding to unoccupied suitable habitat inside the blocks, which is habitat the final prediction map is intended to show.
Spatial cross-validation still only tests places that have occurrence records. The folds partition the geographic distribution of the occurrence records. They do not explicitly partition environmental space, so a high fold score can arise when the held-out blocks share their climates with the training blocks. The folds also say nothing about climates that never appear in the occurrence set. For those areas, use the MESS and ExDet outputs, which flag environmental novelty relative to the full occurrence data.
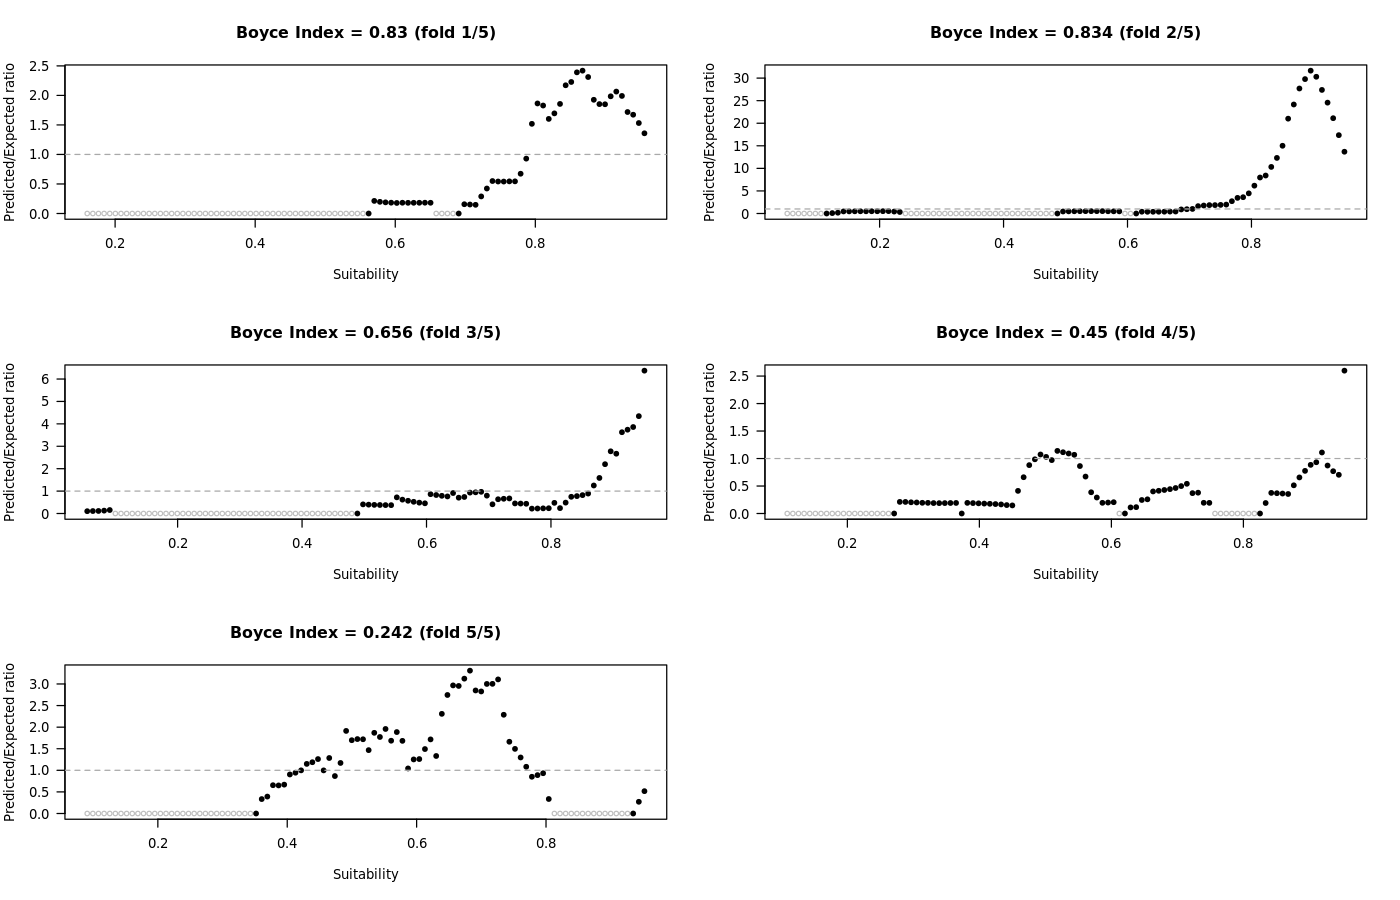
The two figures below are from the same Range Bagging run for Lecanosticta acicola as the full-model plot above, with spatial cross-validation turned on.
The fold indices printed on the curves are 0.83, 0.834, 0.656, 0.45 and 0.242. All five are positive. Their unweighted mean is about 0.60. The full-model index of 0.992 is calculated on the same occurrence records used to fit the model, using suitability across the prediction map. The cross-validation indices are calculated on held-out records, inside the held-out blocks, from refits that did not see those records. The drop from 0.992 to about 0.60 shows that agreement is stronger for records the model was fitted on than for records withheld from fitting. Subtracting the two numbers does not measure how far the performance of the final prediction map fell, because the model and the area being scored both change. Folds 1 and 3 rise towards the highest suitability classes. Fold 2 rises steeply to a predicted-to-expected ratio of about 30 and then eases, while staying well above 1. That peak is why its vertical scale differs from the other panels. Fold 5 climbs through the middle of the suitability range and then falls to about zero in the highest classes, so the classes ranked most suitable are where the held-out presences are scarcest. Fold 4 is irregular, with a hump near the middle of the range, a drop, and a spike at high suitability, so the ranking inside its blocks is only partly in the expected direction. Hollow grey points represent windows of suitability that do not add information to the calculation of the Boyce index. Filled black points are the classes used to calculate the index. The dashed line is a predicted-to-expected ratio of 1 (see above for interpretation). The worked example that follows uses different, illustrative scores, including a negative fold, and it holds one region out together. That is a simpler arrangement than the mixed folds in the map below.
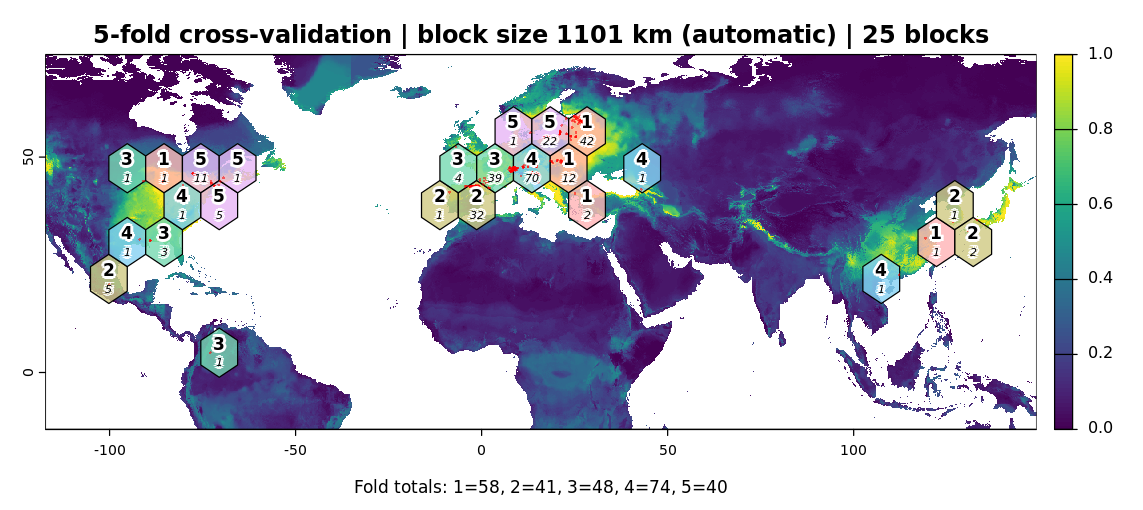
The block map for that run uses 25 hexagons with an automatic width of 1101 km, the block_size_m value of 1,101,000 expressed in kilometres, drawn over the full-model suitability surface. The colours are from the model fitted to every record. Each fold curve is from the refit that did not see that fold. Records lie in eastern North America, Mexico, northern South America, Europe and eastern Asia. The large number in each hexagon is the fold, and the smaller number is the count of occurrence records in that block. The totals printed along the bottom are 58, 41, 48, 74 and 40 records in folds 1 to 5. The unweighted mean gives the fold with 40 records the same weight as the fold with 74. Europe and eastern North America contain blocks from all five folds, so holding one fold out still leaves other blocks from those regions in the training set. Eastern Asia is split across fewer folds. A fold score pools its scattered blocks, and that set of blocks is what the score refers to.
Example: a high full-model Boyce index and a weak fold
Suppose a species is established in Europe, eastern Asia, and eastern North America, where precipitation falls mainly in the warmest quarter (WorldClim BIO18) and the coldest quarter is comparatively dry (BIO19). It is also established in south-western Australia, where that seasonal pattern is reversed: the warmest quarter is dry and the coldest quarter is wet. The Australian sites are the only records with that combination of BIO18 and BIO19. The records are treated as established populations.
The scores below simplify how those records fall into blocks. Hexagon width is set from the full extent of the records, so on a range that spans continents the blocks are usually sub-continental, and the blocks are assigned to the five folds at random. Some Australian records would often sit in training blocks while others are held out, and a fold that holds out Australian blocks would also hold out blocks in Europe, Asia, or North America. The scores that follow are that simpler case: the south-western Australian blocks are held out together, and the refit for that fold uses only the wet-warmest-quarter records. The spatial block map shows how the blocks were actually assigned.
Range Bagging fitted to every record includes both seasonal patterns. The known sites fall in high-suitability parts of the final prediction map, and the full-model Boyce index is high, for example 0.8. In the simpler case, the refit has not seen a dry warmest quarter paired with a wet coldest quarter, so it gives the Australian sites low suitability and that fold’s Boyce index is low or negative, for example −0.4. The other four folds hold out pieces of the shared wet-warmest-quarter climate and stay high, for example 0.6 to 0.8. The mean is pulled down, here to about 0.5, and the standard deviation is large.
In that simpler case, the two results answer different questions. The full-model value of 0.8 says the final prediction map, which was shown the Australian records, places those established sites in suitable climate. The fold value of −0.4 estimates performance in that dry-warmest-quarter climate for a model that was not shown those records: the refit ranked the Australian sites below other cells in the held-out blocks. A new area with that same combination of BIO18 and BIO19 is suitable on the final prediction map because the Australian records were included. The cross-validation says a model built only from the wet-warmest-quarter records would not have identified it. Inside the climates of the known established populations, including the Australian one, the final prediction map is describing climates it was shown. The weak fold is the estimate of how the model performs in that climate when those records are left out.
Climatch does not write a full-model Boyce index. The same fold pattern still applies. The final Climatch map includes the Australian sites because they are in the set being matched, and the low fold is the estimate of the match when those sites are left out.
As on the Lecanosticta acicola map above, the block map is drawn over the full-model suitability surface. The colours come from the model fitted to every record. Each hexagon is labelled with its fold and the number of occurrence records it contains, and a caption lists the number of records in each fold. Use the map to confirm that records are spread across folds and that the blocks are a sensible size for the occurrence extent. A fold with very few records, or one block that covers most of the range, makes that fold's Boyce index unstable.
Block widths are calculated with a planar treatment of longitude and latitude. At high latitudes, and where occurrences span the globe, hexagon shape and width are approximate. Treat block_size_m as the width requested for blocking, and use the map to judge whether the folds separate the records that matter for the question.
Each fold model is predicted only to the held-out records and the grid cells inside the held-out blocks. The suitability map is produced once, from the model fitted to every record, so the added run time is negligible. Turn spatial cross-validation on when you want a check on held-out blocks, and read it with the block map.
Interpreting Boyce outputs
Boyce products are written with the other evaluation outputs (MESS and ExDet). File names are prefixed with the species name.
- interpretation.md: a short Markdown guide for the Boyce scores produced by this run. Start here when reading the evaluation outputs.
- boyce_full.png (Range Bagging): predicted-to-expected ratio against suitability for the full model. A curve that rises with suitability corresponds to a positive Boyce index.
- boyce_folds.png (when spatial cross-validation is enabled): the same curve, in a separate panel for each held-out fold.
- spatial_blocks.png (when spatial cross-validation is enabled): hexagonal blocks, fold labels, record counts, and the suitability map underneath.
- boyce.csv: one row per summary value. Range Bagging includes a full row on every run. Cross-validation rows are added when spatial cross-validation is enabled. Climatch writes this file when spatial cross-validation is enabled, and the file then contains the cross-validation rows.
interpretation.md is written whenever Boyce evaluation products are produced. For Range Bagging that is every run. For Climatch it is written only when spatial cross-validation is enabled, because Climatch reports a Boyce index only from held-out folds. The note is tailored to the algorithm and to the scores from that job: it states the full-model index when Range Bagging ran without cross-validation, and when spatial cross-validation was enabled it summarises the fold scores, mean, standard deviation, and hexagonal block width. It names the companion plot and CSV files for the same run so the figures and table can be opened alongside the text.
The note also explains how to read the Boyce index, what a weak fold can mean, and how Boyce relates to MESS and ExDet. Those explanations match the guidance in this article; the support article remains the place for worked examples and the fuller cross-validation discussion. Use interpretation.md as the run-specific summary, and return here when a fold score or plot needs more context.
Columns in boyce.csv:
- evaluation: full (Range Bagging full model), cv_fold_mean, cv_fold_sd, or cv_fold.
- fold: fold number on each cv_fold row (1 to 5). Blank on the summary rows.
- boyce: the Boyce index for that row. On the cv_fold_sd row this is the standard deviation of the fold indices.
- k: number of folds (5) on the cross-validation rows.
- block_size_m: hexagonal block width in metres on the cross-validation rows.
A fold whose Boyce index cannot be calculated is stored as a missing value and is left out of the mean and standard deviation. This happens when the held-out blocks contain too few predicted cells to form a P/E ratio (fewer than two). The log records the reason. Folds with fewer than 50 predicted cells inside the held-out blocks are still reported, with a warning that the index may be unstable. If every fold fails, the cross-validation summaries are missing and the log records that no valid Boyce index was calculated. In interpretation.md, such a fold is labelled "not calculated".
Common Mistakes in SDM
Confusing environmental suitability with establishment risk
Species distribution models estimate the environmental suitability of a location, not the overall likelihood that a species will establish. A location may be highly suitable but have negligible establishment risk if the species is unlikely to arrive, required hosts are absent, or other ecological constraints prevent persistence.
Best practice: Interpret SDM outputs as only one component of establishment risk. Where possible, combine environmental suitability with estimates of arrival likelihood and biotic suitability within an integrated biosecurity risk assessment framework.
Using incomplete or inappropriate occurrence records
Species distribution models should be fitted using occurrence records that represent the full range of environmental conditions occupied by established populations. Restricting analyses to response records, surveillance detections, recent incursions, or a subset of available occurrence records may substantially underestimate the species' occupied environmental niche and lead to overly conservative predictions. Likewise, occurrence datasets may contain transient or intercepted individuals, spatial errors, duplicate records, or misidentified specimens that can bias model predictions.
Best practice: Where possible, use all available occurrence records from established populations across the species' known distribution. Clean occurrence datasets using automated quality-control tools (e.g. CoordinateCleaner), restrict records to countries where the species is known to be established (e.g. using CABI distribution data or expert knowledge), and undertake expert review where feasible before fitting the model.
Selecting inappropriate environmental predictors
The choice of environmental covariates is one of the largest sources of uncertainty in species distribution modelling. Including large numbers of highly correlated or biologically irrelevant variables can reduce model interpretability and, for some modelling approaches, increase the risk of overfitting. Conversely, omitting important environmental drivers may reduce predictive performance.
Best practice: Select predictor variables based on the known biology and ecology of the species rather than data availability alone. Where possible, choose variables that are expected to influence survival, growth, reproduction, or persistence. Consider the implications of predictor uncertainty when interpreting model outputs.
Ignoring extrapolation diagnostics
Species distribution models become increasingly uncertain when projected into environmental conditions that were not represented in the occurrence data used to fit the model. This is particularly common when transferring models to new geographic regions or future climate scenarios.
Best practice: Use MESS and ExDet outputs to identify areas of environmental novelty and interpret predictions in these regions with appropriate caution.
Failing to align temporal scales
Environmental datasets represent climatic conditions over a specific period. Using occurrence records collected outside this period may associate species observations with environmental conditions that did not exist when the records were collected, potentially biasing model predictions.
Best practice: Align the temporal range of occurrence records with the environmental datasets used for modelling (e.g. post-1970 occurrence records when using WorldClim 2.1).
Ignoring model uncertainty
All species distribution models involve uncertainty arising from occurrence records, environmental predictors, model assumptions, and extrapolation beyond the training data. Presenting a single prediction without considering these uncertainties can lead to overconfidence in model outputs.
Best practice: Consider the assumptions and limitations of the chosen modelling approach, examine extrapolation diagnostics, and interpret predictions alongside their associated sources of uncertainty. Where appropriate, compare predictions across multiple modelling approaches.
Judging performance from the training records
A Boyce index calculated on the same occurrence records used to fit the model describes agreement with those training records. Clustered records share environments with their neighbours, so this full-model score can give an optimistic impression of performance in a region the model has not seen. For Climatch the same calculation is uninformative, because every training location receives the maximum score.
Best practice: Enable spatial cross-validation and interpret cv_fold_mean together with cv_fold_sd, the fold curves, and the spatial block map. cv_fold_mean is the unweighted mean of the scores on held-out blocks. For Range Bagging, read a high full-model Boyce index as agreement with the records used to fit the map. Use the block map before reading a low fold score as failure in one region, because a fold mixes blocks from different parts of the range. Where a fold is weak because its blocks occupy climate the other records in that fold do not cover, the low score estimates a model extrapolating into that climate. The final model includes those records, so inside that climate it is not doing the same extrapolation.
Over-interpreting spatial resolution
The spatial resolution of a model output does not necessarily reflect its accuracy. Fine-resolution maps can imply a level of precision that is unsupported by the quality of the occurrence records, environmental covariates, or modelling assumptions.
Best practice: Match interpretation to the scale and quality of the input data, and avoid drawing fine-scale management conclusions from coarse-resolution or uncertain inputs.
Treating model outputs as absolute probabilities
Different species distribution modelling methods produce different types of outputs. For example, Climatch produces climatic similarity scores, Range Bagging estimates environmental suitability based on the proportion of ensemble models identifying a location as suitable, and other methods (e.g. Maxent) produce measures of relative suitability rather than true probabilities of establishment. Interpreting these outputs as absolute probabilities, or directly comparing values across different modelling approaches, can lead to incorrect conclusions.
Best practice: Understand what the chosen modelling algorithm estimates and interpret outputs accordingly. Comparisons among models should focus on the relative spatial patterns they identify rather than assuming that output values have the same meaning.
Want to use our R package?
Biosecurity Commons is powered by a number of specially built R packages. If you would like to use our SDM methods in R please visit our bssdm GitLab page.
References
- Briscoe, N. J. et. al. (2019). Forecasting species range dynamics with process-explicit models: matching methods to applications. Ecol Lett, 22: 1940-1956.
- Broennimann, O., Di Cola, V., & Guisan, A. (2025). ecospat: Spatial Ecology Miscellaneous Methods. R package version 4.1.2.
- Camac, J. S. (2024). Detect: Designing post-border surveillance schemes. In Hester et al. (Eds.), Biosecurity: A Systems Perspective. Taylor & Francis.
- Crombie, J., Brown, L., Lizzio, J., & Hood, G. (2008). Climatch user manual.
- Drake, J.M. (2015) Range bagging: a new method for ecological niche modelling from presence-only data. J R Soc Interface; 12 (107): 20150086.
- Elith, J., Kearney, M., & Phillips, S. (2010). The art of modelling range-shifting species.Methods Ecol Evol., 1: 330-342.
- Hirzel, A. H., Le Lay, G., Helfer, V., Randin, C., & Guisan, A. (2006). Evaluating the ability of habitat suitability models to predict species presences. Ecological Modelling, 199: 142–152.
- Jiménez-Valverde, A., Peterson, A. T., Soberón, J., Overton, J. M., Aragón, P., & Lobo, J. M. (2011). Use of niche models in invasive species risk assessments. Biological Invasions, 13: 2785–2797.
- Mesgaran, M.B., Cousens, R.D. and Webber, B.L. (2014). Here be dragons: a tool for quantifying novelty due to covariate range and correlation change when projecting species distribution models. Diversity Distrib., 20: 1147-1159.
- Roberts, D. R. et al. (2017). Cross-validation strategies for data with temporal, spatial, hierarchical, or phylogenetic structure. Ecography, 40: 913–929.
- Valavi, R., Elith, J., Lahoz-Monfort, J. J., & Guillera-Arroita, G. (2019). blockCV: An R package for generating spatially or environmentally separated folds for k-fold cross-validation of species distribution models. Methods Ecol Evol., 10: 225–232.
- Zizka A, Silvestro D, Andermann T, et al (2019). CoordinateCleaner: Standardized cleaning of occurrence records from biological collection databases. Methods Ecol Evol. 2019;10:744–751.
Was this article helpful?
That’s Great!
Thank you for your feedback
Sorry! We couldn't be helpful
Thank you for your feedback
Feedback sent
We appreciate your effort and will try to fix the article