- Surveillance Design
- Linkages to other workflows
- Creating a Surveillance Design
- Step 1. Create a new project
- Step 2. Specify the surveillance
- Step 3. Specify the design method
- Step 4. Specify the environment
- Step 5. Specify the parameters
- Step 6. Specify the allocation
- Step 7. Run the surveillance design
- Step 8. Exporting outputs for use in other workflows
Surveillance Design
Pre-border measures and border control protocols constitute critical components in mitigating biosecurity risks, although complete threat elimination remains unattainable. In regions potentially exposed to biological threats, regulatory authorities implement comprehensive surveillance systems as their primary risk management framework. These systems are designed to facilitate early detection protocols, enabling authorities to identify and respond to potential outbreaks before they escalate to levels that could precipitate significant economic disruption, social instability, or environmental degradation.
Surveillance systems also serve a crucial verification function, establishing and maintaining documentation of disease-free status within specified regions. This verification mechanism is instrumental in both preserving existing trade relationships and facilitating the restoration of market access following biosecurity incidents. Furthermore, these systems generate critical data regarding ground-level response operations, including the delineation of outbreak, progression monitoring, and quantitative assessment of eradication initiatives.
Regardless of the objective, a fundamental challenge faced by surveillance practitioners is determining where to prioritise surveillance, and how much to allocate.
Biosecurity Commons provides a comprehensive Surveillance Design workflow that enables users to optimize their surveillance resource allocation through sophisticated analytical tools. This system can leverage geographic mapping capabilities, location-specific probability assessments, and actual occurrence data, while incorporating surveillance effectiveness metrics and operational constraints, including budgetary limitations and required detection confidence levels.
The workflow allows users to optimize surveillance allocation using different objectives including:
- Minimising total costs, that is surveillance resource costs plus likely incursion management costs (estimated with and without detection)
- Maximising a total saving (or monetary benefit minus surveillance costs)
- Maximising a total non-monetary benefit measure (e.g. species richness)
- Maximising the number of detections (equivalent to uniform benefit)
- Maximising overall detection confidence or sensitivity, that is the probability of detection if the invasive species is present
The workflow can also be utilised to determine the sensitivity of existing surveillance allocations, which may vary temporally. The existing system-wide sensitivities may then be utilised for area freedom analysis via the Proof of Freedom workflow.
For more details about the Surveillance Design please see the Surveillance Design workflow overview support article.
Linkages to other workflows
Outputs from other Biosecurity Commons workflows may be used as inputs in Surveillance Design workflows, for example:
- Risk Mapping workflows provide outputs for spatial distributions of threat suitability, arrival and establishment likelihood, which may be utilised as occurrence likelihood inputs for Surveillance Design workflows.
- Population Spread Modelling workflows provide outputs for simulated mean spatial occupancy and population abundance at collated simulation time steps, which may be utilised as occurrence likelihood inputs for Surveillance Design workflows.
- Impact Analysis workflows provide outputs for spatial distributions of the costs or non-monetary impacts of invasive species incursions, which may be utilised as saving or benefit inputs for Surveillance Design workflows.
Outputs of Surveillance Design workflows can be used directly as inputs in other workflows, for example:
- Surveillance Design workflows provide outputs for spatial distributions of sensitivity (detection probabilities), which may be utilised as simulated detection management action inputs for Population Spread Modelling workflows.
- Surveillance Design workflows provide outputs of system-wide surveillance sensitivities (detection probabilities) based on different optimisation strategies or existing surveillance designs, which may be utilised as sensitivity (detection probability) inputs for Proof of Freedom workflows to determine confidence or probabilities of absence (given no detections).
- Surveillance Design and Population Spread Modelling workflows can thus be utilised iteratively as inputs and outputs for one another to refine an effective allocation of surveillance resources.
Creating a Surveillance Design
Step 1. Create a new project
Select the Surveillance Design workflow and then select “Create new Project”.
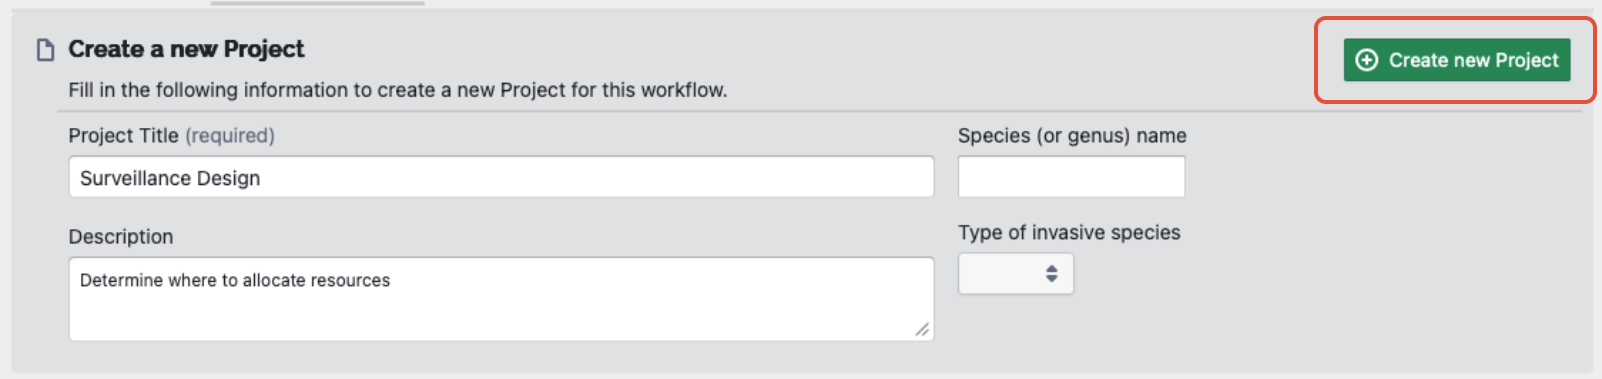
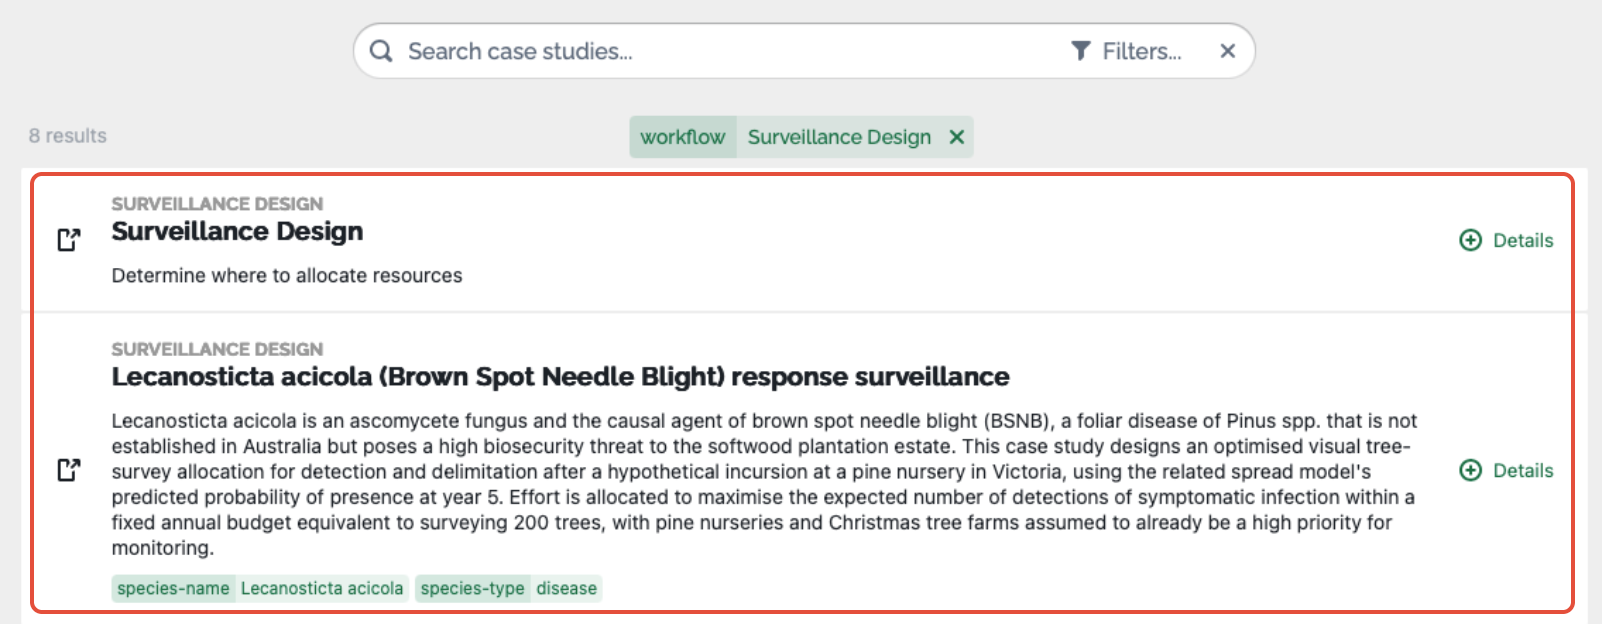
When creating a new surveillance design project, users can start with an empty project, initially titled “Surveillance Design”, or they can choose from a range of pre-populated case studies that have been constructed as examples of the workflow or based on previous case studies (e.g. “Orange Hawkweed, Falls Creek”).
The empty template is ideal for those wishing to create a brand-new surveillance design as it contains:
- The basic structure of the Surveillance Design workflow
- No preloaded datasets (except for the default region, albeit this can be easily changed)
By contrast, example templates provide users with the opportunity to see a completed demonstration of how surveillance designs can be produced, or if based on a real-world case study, how others have attempted to create a model.
Select a template and then give your project an appropriate title. Users can optionally provide additional descriptive details under the “Description”, “Species name” and “Species type” fields. These metadata are presently unused but will provide future flexibility in filtering and summarising projects.
Once details have been provided, click the green “Create a new Project” button in the bottom right-hand corner to continue.
When you start a Surveillance Design workflow from an empty template you will be presented with the core elements of the Surveillance Design workflow on the left side of the screen – “Surveillance”, “Design Method” and “Surveillance Design”. Orange exclamation points indicate steps that require attention and, as you progress through the project, these change to green ticks when complete.
Step 2. Specify the surveillance
Select appropriate details of the context of your surveillance, including:
- Surveillance type: The type of surveillance utilized in the design (e.g. surveys, traps, samples)
- Surveillance quantity unit: The unit to express quantities of surveillance (e.g. units, hours, traps, samples)
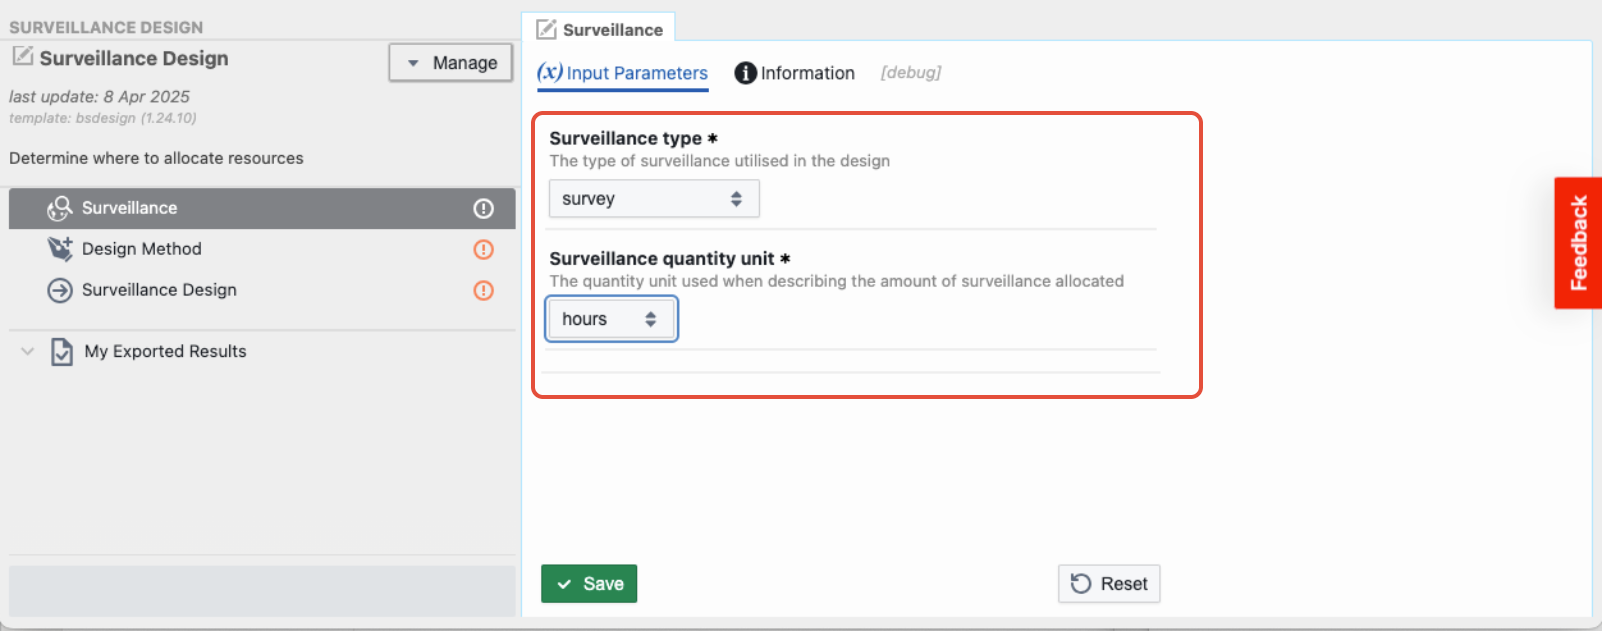
“Save” your selections when finished.
Step 3. Specify the design method
Select your surveillance design method. Currently the following methods are available:
- Discrete Sampling: For the effective allocation of discrete sampling across spatial locations or other aspatial divisions (e.g. categories, species)
- Continuous Surveillance: For the effective allocation of continuous surveillance resources across spatial locations or other aspatial divisions (e.g. categories, species)
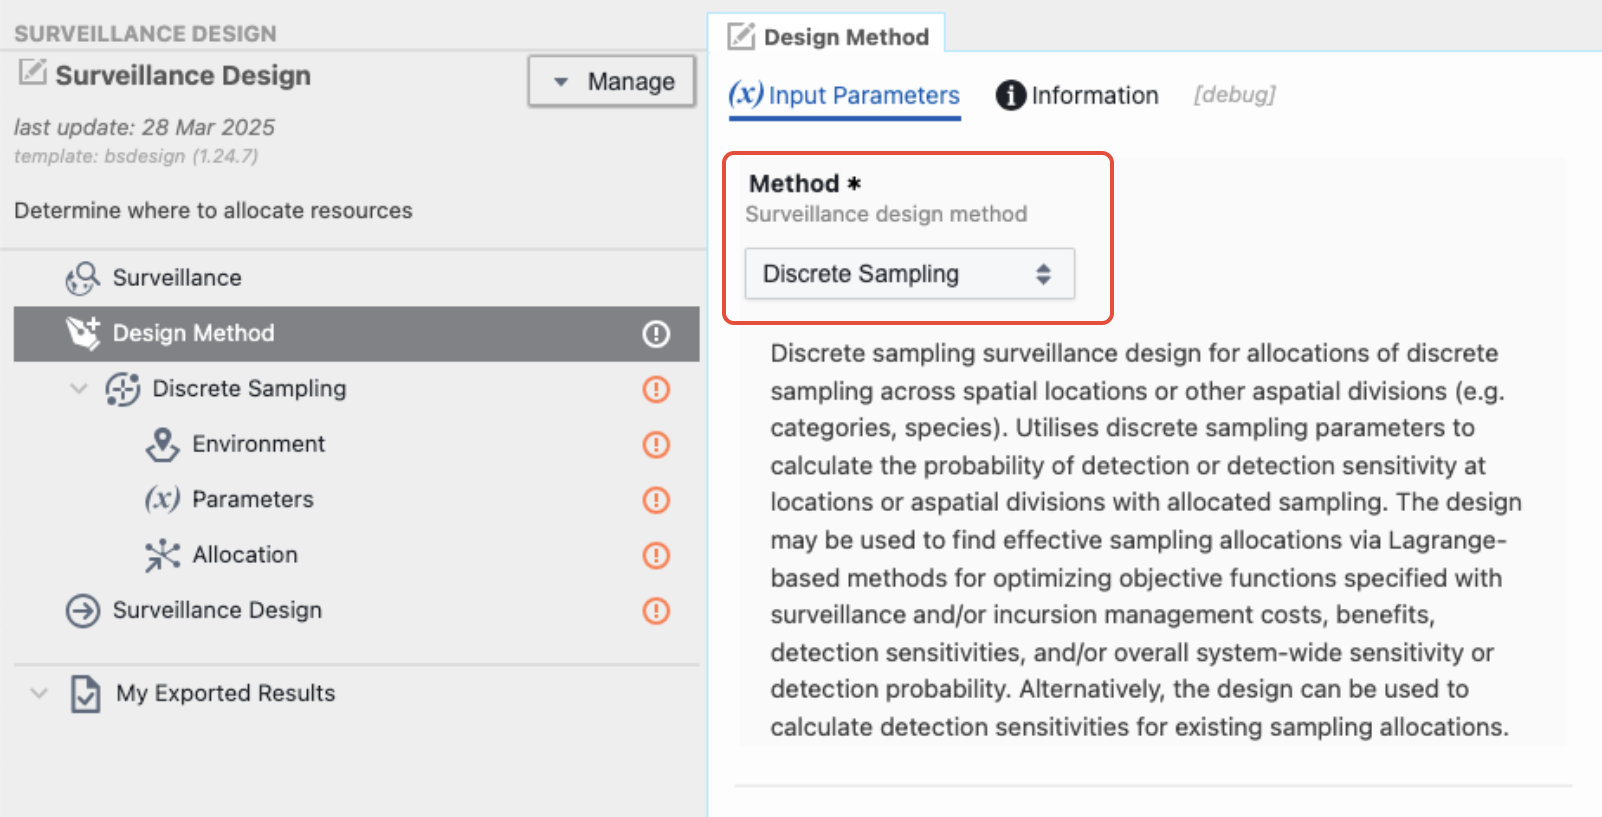
Other surveillance design methods are anticipated in future versions of the Biosecurity Commons platform.
Depending on the method the user selects, different options will become available within the method sections:
- Environment – defines the location or division partitions for the design and the occurrence probability at each partition
- Parameters – defines parameters specific to the surveillance method, such as the parameters associated with calculating the sensitivity (detection probability) for given allocations of discrete samples or continuous surveillance resources
- Allocation – defines how effective surveillance resources are allocated, via optimisation approaches given chosen objectives (e.g. minimum total cost), constraints (e.g. total budget), and other optional parameters (e.g. fixed costs). Alternatively, existing resource allocations may be analysed (i.e. sensitivities calculated)
The “Environment” and “Allocation” sections are generally common to the surveillance methods.
Step 4. Specify the environment
Select the “Environment” section under the chosen surveillance method to define how the surveillance resources will be partitioned across spatial locations or other aspatial divisions, such as categories, species, or resource types. Users then specify:
- Division type (Required): Defines the type of surveillance resource allocation divisions to be used via selection:
- Raster grid – surveillance resources allocated across raster grid cells (GeoTIFF)
- Spatial locations – surveillance resources allocated across spatial locations defined via longitude and latitude coordinates (CSV)
- Other divisions – surveillance resources allocated across other aspatial divisions, such as categories, species, or resource types (CSV)
Subsequent parameters across the workflow are configured differently dependent on the division type selected (raster grid, spatial locations, or other divisions). Next, users specify either:
1. Raster grid division type
- Region raster (Required): Raster grid (GeoTIFF) defining the extent, projection and resolution for the surveillance design
- Conform method (Required): Method used to conform other model raster layers so that corresponding defined (non-NA) and undefined (NA) value cells match the region layer, select either:
- Zero undefined values - any cells with undefined (NA) values that do not correspond to undefined (NA) values in the region layer will be set to zero. This default method is useful when available model layers differ in their spatial distribution of defined (non-NA) and undefined (NA) value cells.
- Nearest defined values - Any cells with undefined (NA) values that do not correspond to undefined (NA) values in the region layer will be set to the (mean) value of the nearest cell(s) with defined values. This method is useful for correcting mismatching borders or coastlines, especially those with differing resolutions.
- Occurrence probability (Required): Probability values to represent the likelihood of invasive species occurrence at each region spatial location (as raster GeoTIFF). Also:
- Specify via the “Relative probability” checkbox whether these probabilities are actual probabilities (unchecked) or relative weights (checked). Note that actual probabilities are required for cost-based or system-wide sensitivity-based optimisation of surveillance allocations (see Step 6)
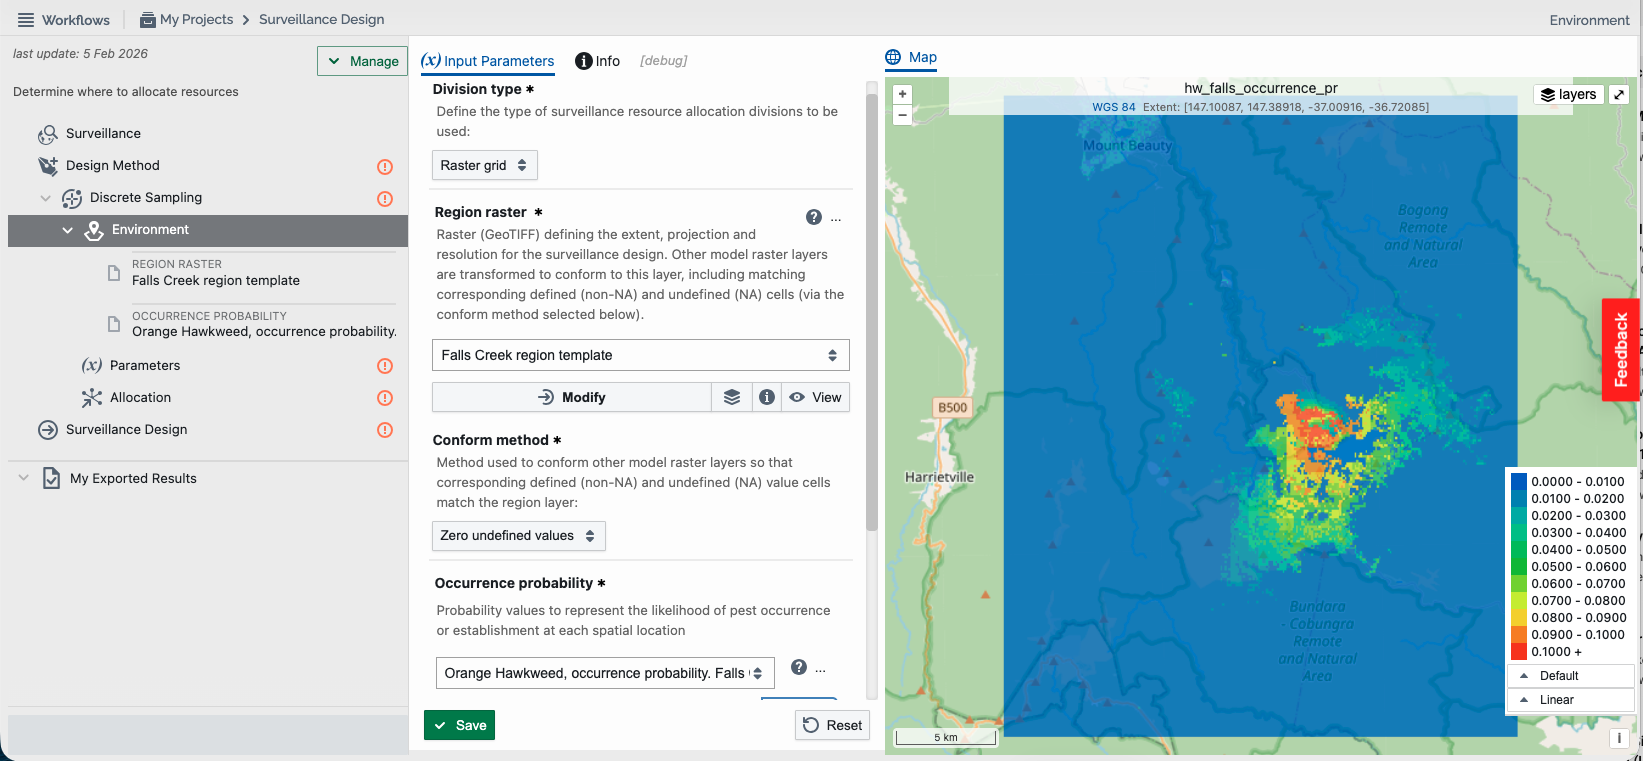
Select “Save” if enabled (note that data file selection may autosave your selections).
2. Spatial locations division type
- Region CSV (Required): Locations or patches may be defined via a CSV table of location coordinates in longitude and latitude (WGS84) with explicitly named columns 'lon' and 'lat'. For convenience, additional columns for other model parameters may also be included in this CSV file
- Occurrence probability (Required): Probability values to represent the likelihood of invasive species occurrence at each region spatial location. Also:
- Select the checkbox “Use column 'establish_pr' included in Region CSV” if the column has been included in the Region CSV, or define it separately by selecting another CSV file having aligned ‘lon’, ‘lat’, and 'establish_pr' columns
- Specify via the “Relative probability” checkbox (as per OPTION 1) if the probabilities are actual (unchecked) or relative (checked). Note that actual probabilities are required for cost-based or system-wide sensitivity-based optimisation of surveillance resource allocation (see Step 6)
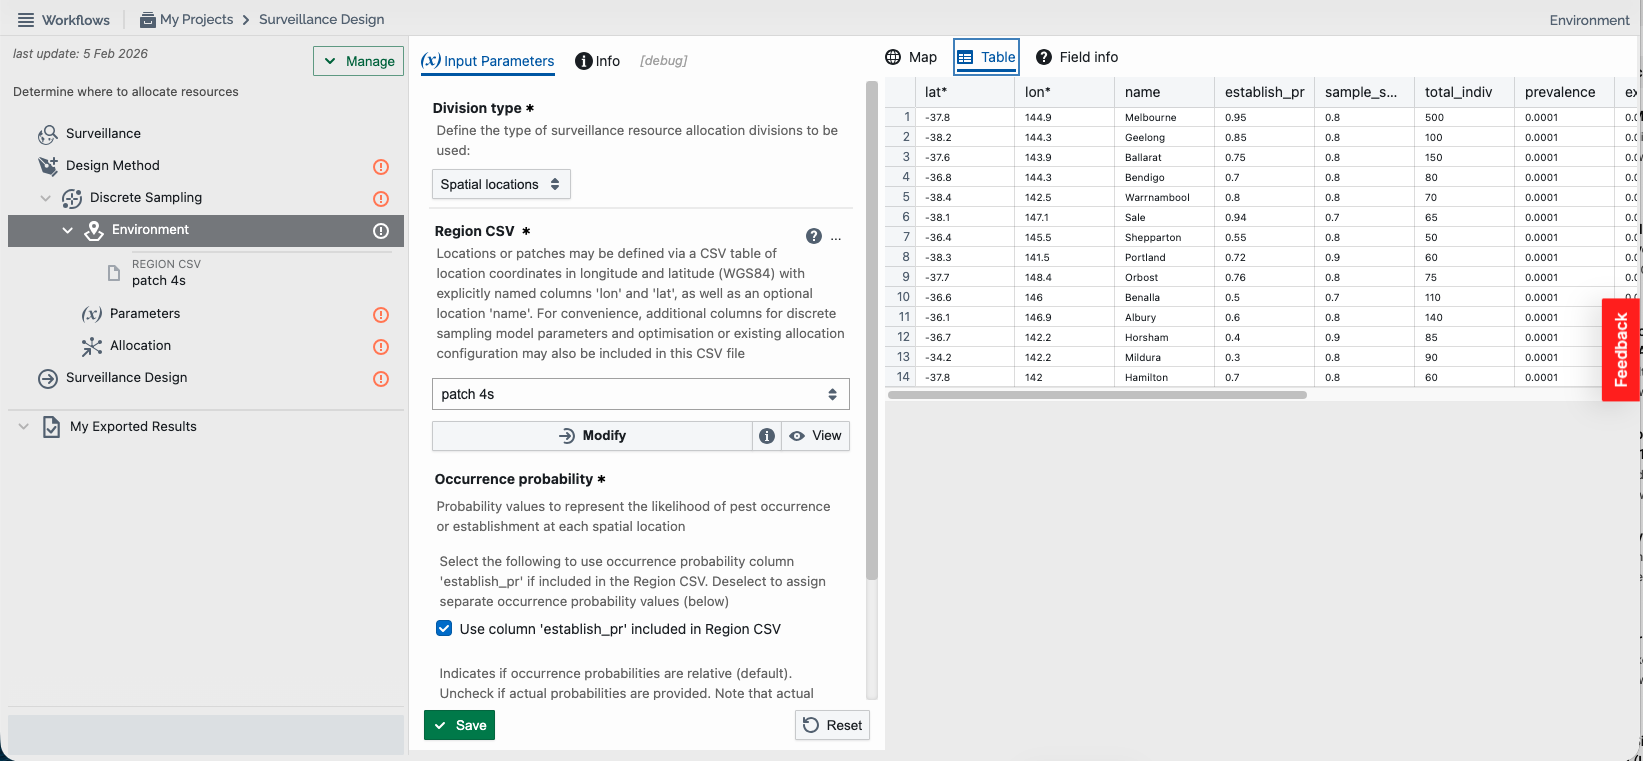
Select “Save” if enabled (note that data file selection may autosave your selections).
3. Other divisions type
- Divisions CSV (Required): Other/aspatial divisions may be defined via a CSV table with a numeric identifier 'id' per division. For convenience, additional columns for other model parameters may also be included in this CSV file
- Occurrence probability (Required): Probability values to represent the likelihood of invasive species occurrence at each aspatial division. Also:
- Select the checkbox “Use column 'establish_pr' included in Divisions CSV” if the column has been included in the Divisions CSV, or define it separately by selecting another CSV file having aligned ‘id’ and 'establish_pr' columns
- Specify via the “Relative probability” checkbox (as per OPTION 1) if the probabilities are actual (unchecked) or relative (checked). Note that actual probabilities are required for cost-based or system-wide sensitivity-based optimisation of surveillance resource allocation (see Step 6)
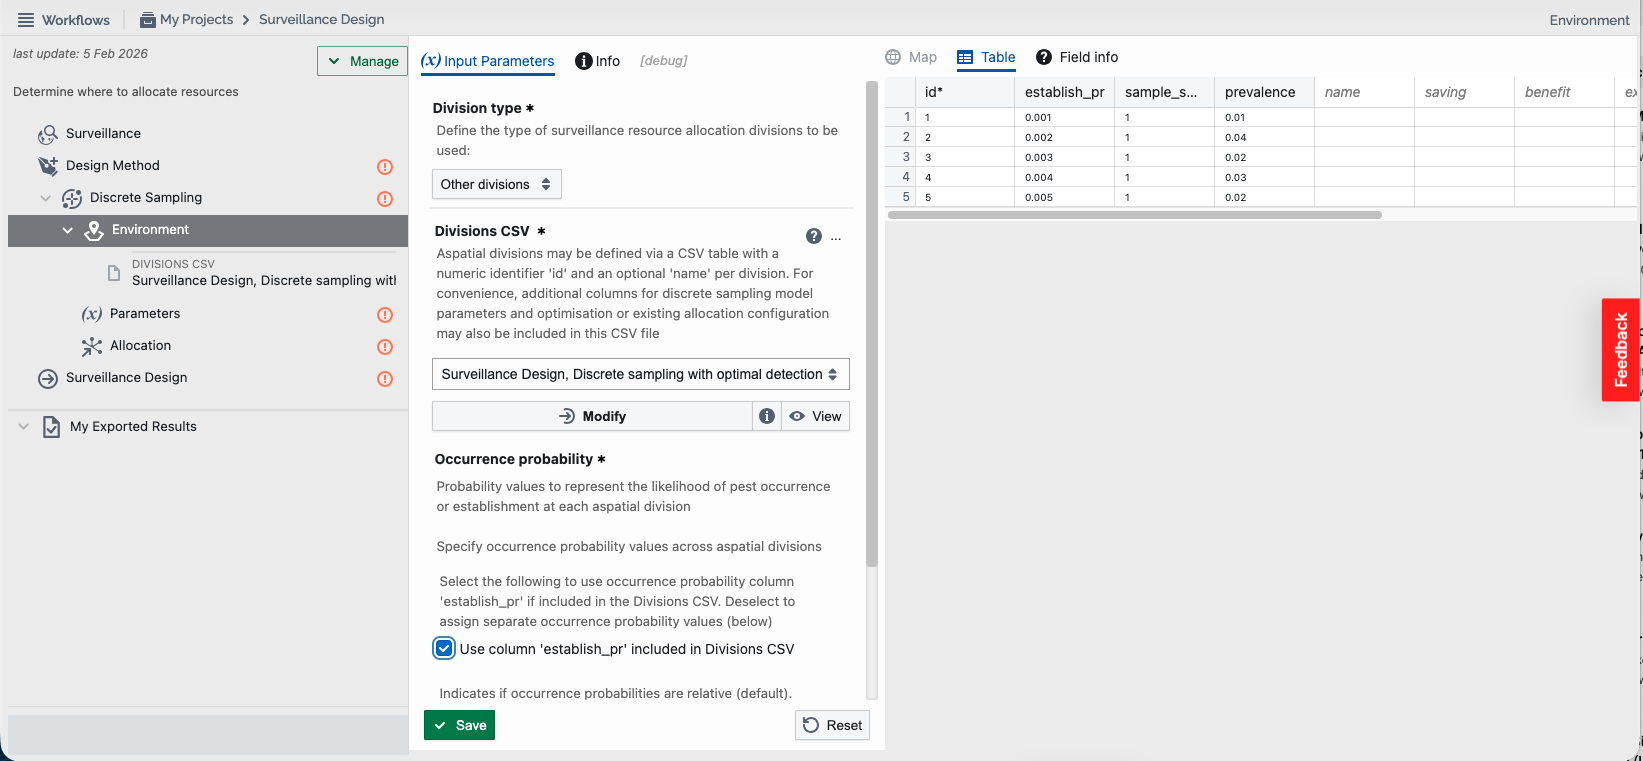
Select “Save” if enabled (note that data file selection may autosave your selections).
Step 5. Specify the parameters
Select the “Parameters” section under the chosen surveillance method to define the parameters specific to the surveillance method. Dependent on the design method users specified in Step 3, either:
1. Discrete Sampling
- Total sample units (Required): Total number of susceptible units, such as individual plants or animals, collectives (e.g. herds, nests, etc.), or partitioned areas of susceptible organisms (e.g. orchids, plots, paddocks, farms, enclosures, etc.), available for sampling at each spatial location or other/aspatial division (if known). Firstly, select:
- Indication of whether the total individuals are ‘known’ or ‘unknown’
- If ‘known’ the total individual values at each location or division may be defined, dependent on the division type selected in Step 4:
- Raster grid (GeoTIFF)
- Spatial locations – either select the checkbox “Use column 'total_indiv' when included in Region CSV”, or define it separately by selecting another CSV file having aligned ‘lon’, ‘lat’, and 'total_indiv' columns
- Other divisions – either select the checkbox “Use column 'total_indiv' when included in Divisions CSV”, or define it separately by selecting another CSV file having aligned ‘id’ and 'total_indiv' columns
- If ‘unknown’ the total individual values are not required, which assumes that <= 10% of total individuals are sampled
- Sample sensitivity (Required): Probability of detection (given threat presence) for each sample. This is defined such that the probability of detecting an incursion when present within a spatial location or aspatial division can be expressed via:
- 1 - (1 - sensitivity*sampled/total)^(prevalence*total)
(when total individuals is ‘known’) - 1 - (1 - sensitivity*prevalence)^sampled
(when total individuals is ‘unknown’ and assuming <= 10% sampled)
- 1 - (1 - sensitivity*sampled/total)^(prevalence*total)
for given number sampled at a specified prevalence level. Specify either:
- As a ‘single value’ for the entire study
- Vary values ‘across locations’ (raster or point) or ‘across divisions’ (aspatial), defined dependent on the division type selected in Step 4:
- Raster grid (GeoTIFF)
- Spatial locations – either select the checkbox “Use column ‘sample_sens’ when included in Region CSV”, or define it separately by selecting another CSV file having aligned ‘lon’, ‘lat’, and ‘sample_sens’ columns
- Other divisions – either select the checkbox “Use column ‘sample_sens’ when included in Divisions CSV”, or define it separately by selecting another CSV file having aligned ‘id’ and ‘sample_sens’ columns
- Prevalence (Required): The prevalence of the target organism, or the proportion of individuals infected, at which the sampling is designed to detect. This is used in defining the probability of detecting an incursion when present (as per sample sensitivity above). Specify either:
- As a ‘single value’ for the entire study
- Vary values ‘across locations’ (raster or point) or ‘across divisions’ (aspatial), defined dependent on the division type selected in Step 4:
- Raster grid (GeoTIFF)
- Spatial locations – either select the checkbox “Use column ‘prevalence’ when included in Region CSV”, or define it separately by selecting another CSV file having aligned ‘lon’, ‘lat’, and ‘prevalence’ columns
- Other divisions – either select the checkbox “Use column ‘prevalence’ when included in Divisions CSV”, or define it separately by selecting another CSV file having aligned ‘id’ and ‘prevalence’ columns
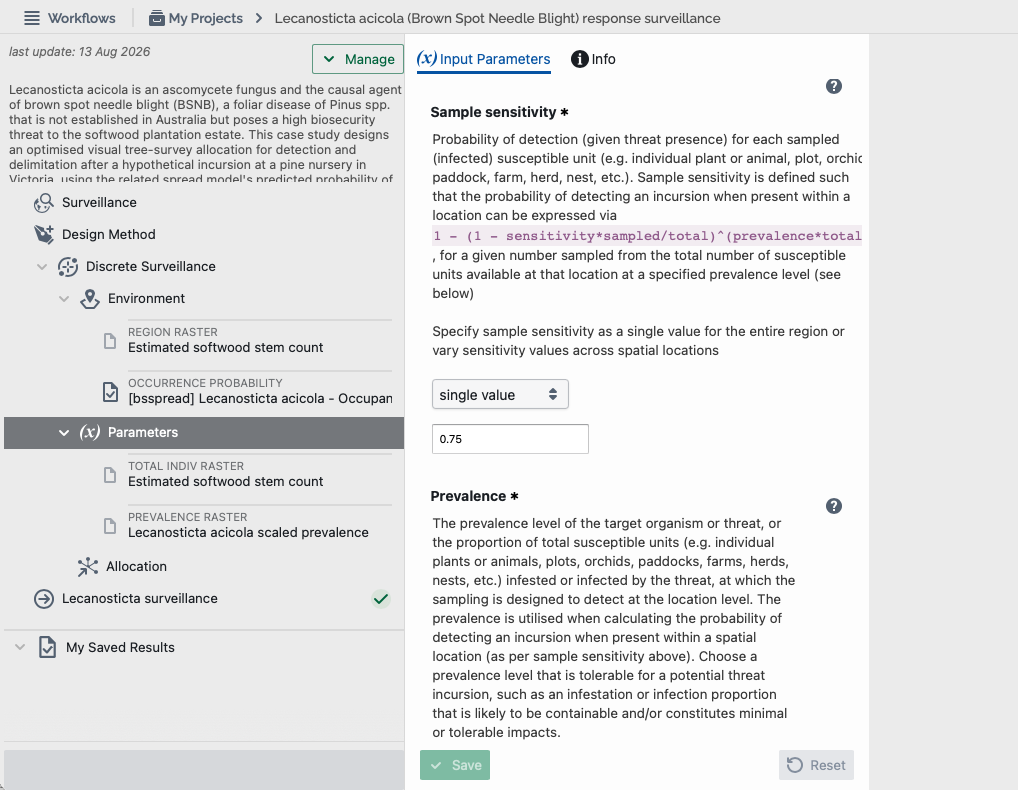
Select “Save” if enabled (note that data file selection may autosave your selections).
2. Continuous Surveillance
- Continuous type (Required): The type of continuous surveillance to be used, select either:
- Continuous area 'sampling' (e.g. effective area of traps, detectors, or survey transects)
- Continuous 'effort' (e.g. surveying time)
The parameters that follow are dependent on the continuous type selected.
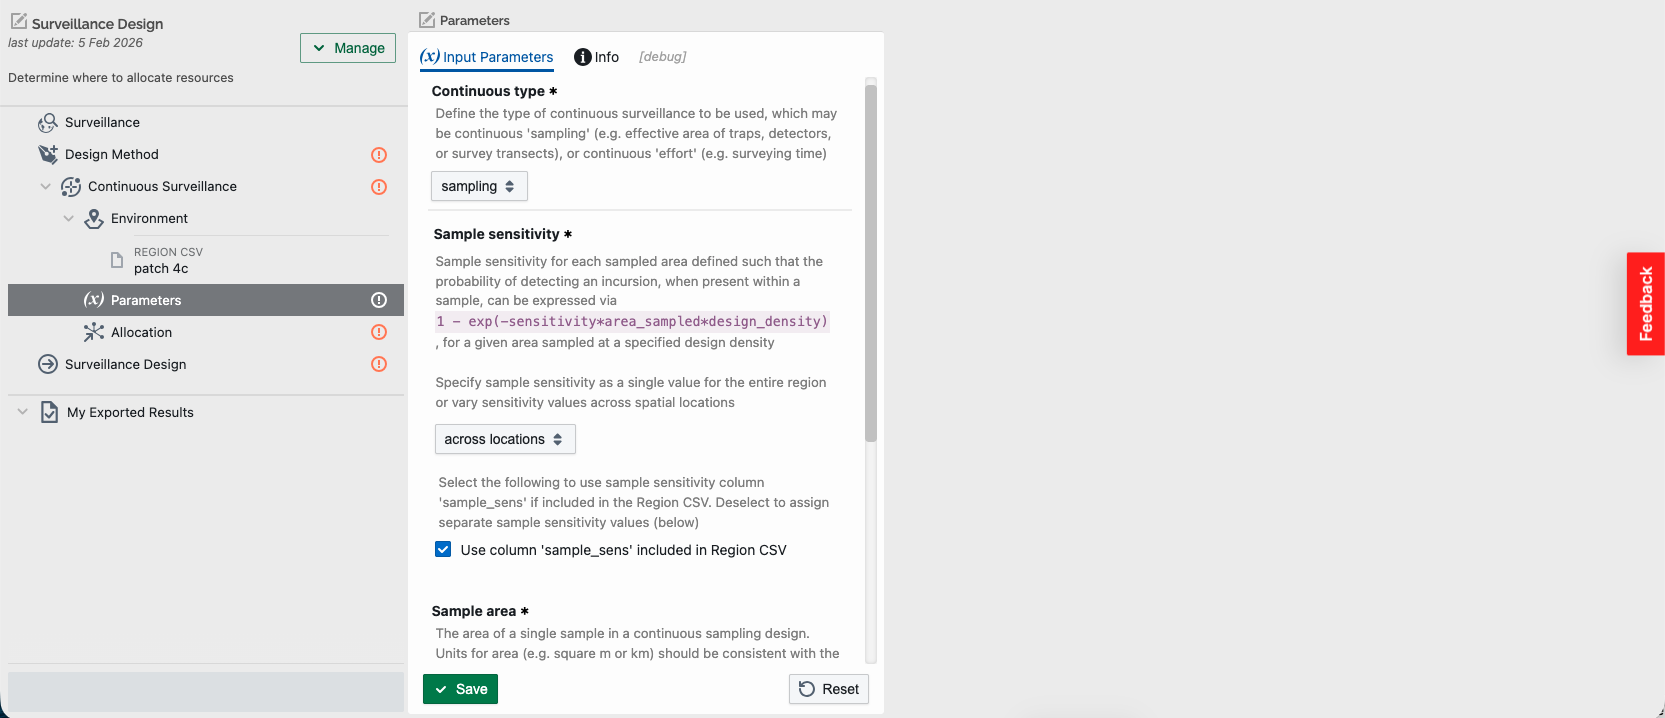
2.1. Continuous area sampling
- Sample sensitivity (Required): Probability of detection (given threat presence) for each sampled. This is defined such that the probability of detecting an incursion when present within a spatial location or aspatial division can be expressed via:
- 1 - exp(-sensitivity*area_sampled*design_density)
for a given area sampled at a specified design density. Specify either:
- As a ‘single value’ for the entire study
- Vary values ‘across locations’ (raster or point) or ‘across divisions’ (aspatial), defined dependent on the division type selected in Step 4:
- Raster grid (GeoTIFF)
- Spatial locations – either select the checkbox “Use column ‘sample_sens’ when included in Region CSV”, or define it separately by selecting another CSV file having aligned ‘lon’, ‘lat’, and ‘sample_sens’ columns
- Other divisions – either select the checkbox “Use column ‘sample_sens’ when included in Divisions CSV”, or define it separately by selecting another CSV file having aligned ‘id’ and ‘sample_sens’ columns
- Sample area (Required): The area of a single sample in a continuous sampling design. Units for area (e.g. m2 or km2) should be consistent with the design density (below). Note that when set to 1 (default), the total number of samples will be equivalent to the total area sampled
- Design density (Required): The density of the target organism at which the continuous sampling is designed to detect. This is used in defining the probability of detecting an incursion when present (as per sample sensitivity above). Specify either:
- As a ‘single value’ for the entire study
- Vary values ‘across locations’ (raster or point) or ‘across divisions’ (aspatial), defined dependent on the division type selected in Step 4:
- Raster grid (GeoTIFF)
- Spatial locations – either select the checkbox “Use column ‘design_dens’ when included in Region CSV”, or define it separately by selecting another CSV file having aligned ‘lon’, ‘lat’, and ‘design_dens’ columns
- Other divisions – either select the checkbox “Use column ‘design_dens’ when included in Divisions CSV”, or define it separately by selecting another CSV file having aligned ‘id’ and ‘design_dens’ columns
Select “Save” if enabled (note that data file selection may autosave your selections).
2.2. Continuous effort
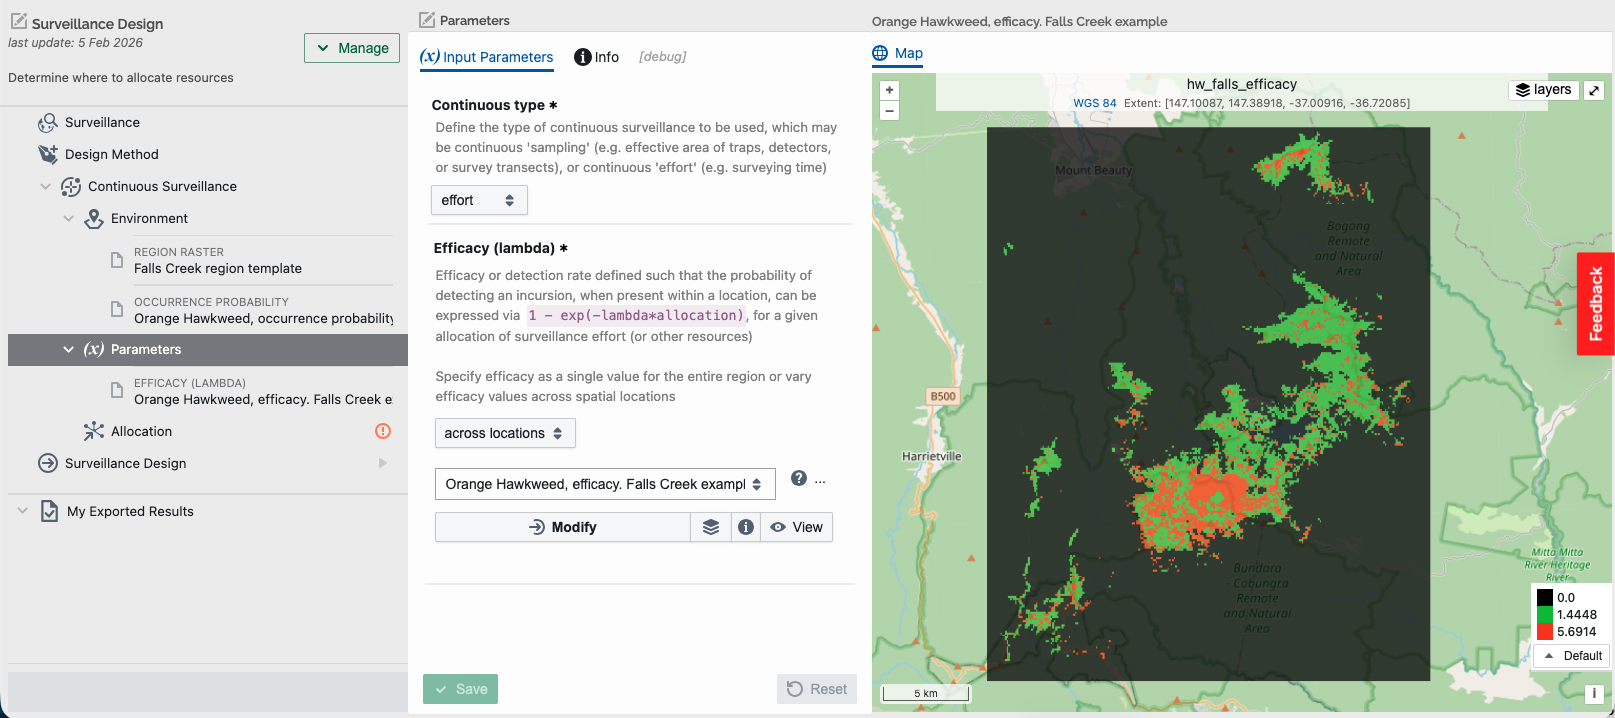
- Efficacy (lambda) (Required): Efficacy or detection rate defined such that the probability of detecting an incursion, when present within a spatial location or aspatial division, can be expressed:
- 1 - exp(-lambda*allocation)
for a given allocation of surveillance effort (or other resources). Specify either:
- As a ‘single value’ for the entire study
- Vary values ‘across locations’ (raster or point) or ‘across divisions’ (aspatial), defined dependent on the division type selected in Step 4:
- Raster grid (GeoTIFF)
- Spatial locations – either select the checkbox “Use column ‘lambda’ when included in Region CSV”, or define it separately by selecting another CSV file having aligned ‘lon’, ‘lat’, and ‘lambda’ columns
- Other divisions – either select the checkbox “Use column ‘lambda’ when included in Divisions CSV”, or define it separately by selecting another CSV file having aligned ‘id’ and ‘lambda’ columns
Select “Save” if enabled (note that data file selection may autosave your selections).
Step 6. Specify the allocation
Select the “Allocation” section under the chosen surveillance method to define how effective surveillance resources are allocated, via optimisation approaches given chosen objectives (e.g. minimum total cost), constraints (e.g. total budget), and other optional parameters (e.g. fixed costs). Alternatively, existing resource allocations may be analysed (i.e. sensitivities calculated). Users then specify:
- Allocation design (Required): Defines the surveillance resource allocation design to be used via selection:
- Optimisation – find an effective allocation of surveillance resources
- Existing – calculate sensitivities for an existing surveillance design
- Optimisation – find an effective allocation of surveillance resources
Subsequent parameters in the allocation section are configured differently dependent on the allocation design selected (optimisation or existing).
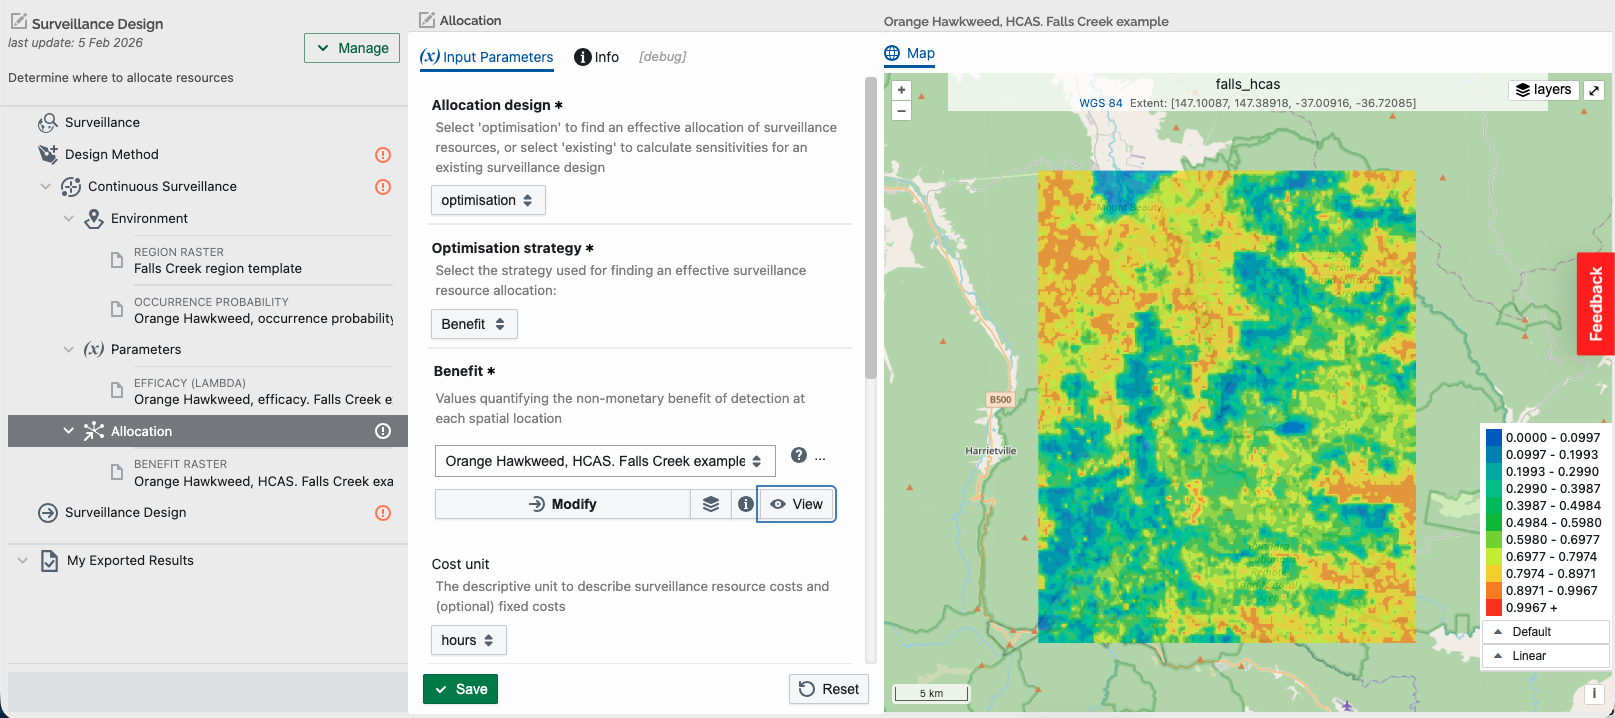
1. Optimisation
Optimisation parameters are made available after specifying:
- Optimisation strategy (Required): The strategy used for finding an effective surveillance resource allocation via selection:
- Cost – minimise total surveillance and incursion management costs
- Saving – maximise total monetary saving (or cost-dependent benefit)
- Benefit – maximise total non-monetary benefit
- Detections – maximise the total number of detections
- Sensitivity – maximise the overall system-wide sensitivity (detection probability)
Note that the cost-based options (cost and savings) and the system-wide sensitivity option will only be available when actual occurrence probabilities are provided in Step 4, that is the “Relative probability” checkbox is unchecked.
- Management cost (Required for ‘cost’ optimisation): Represents estimated management costs for when the incursion is detected and undetected, which are configured via entries:
- Detected (Required)
- Undetected (Required)
- Saving (Required for ‘saving’ optimisation): Values quantifying the monetary saving (or cost-dependent benefit) of detection at each spatial location or aspatial division, defined dependent on the division type selected in Step 4:
- Raster grid (GeoTIFF)
- Spatial locations – either select the checkbox “Use column ‘saving’ when included in Region CSV”, or define it separately by selecting another CSV file having aligned ‘lon’, ‘lat’, and ‘saving’ columns
- Other divisions – either select the checkbox “Use column ‘saving’ when included in Divisions CSV”, or define it separately by selecting another CSV file having aligned ‘id’ and ‘saving’ columns
- Benefit (Required for ‘cost’ optimisation): Values quantifying the non-monetary benefit of detection at each spatial location or aspatial division, defined dependent on the division type selected in Step 4:
- Raster grid (GeoTIFF)
- Spatial locations – either select the checkbox “Use column ‘benefit’ when included in Region CSV”, or define it separately by selecting another CSV file having aligned ‘lon’, ‘lat’, and ‘benefit’ columns
- Other divisions – either select the checkbox “Use column ‘benefit’ when included in Divisions CSV”, or define it separately by selecting another CSV file having aligned ‘id’ and ‘benefit’ columns
- Cost unit (Required for ‘cost’ or ‘saving’ optimisation): The unit to describe surveillance, management, saving, and/or optional fixed costs (e.g. $, hours)
- Sample cost (Required for ‘cost’ or ‘saving’ optimisation, or if a cost unit is defined): Either the cost per:
- sample when discrete sampling selected in Step 3
- sample area when continuous surveillance selected in Step 3 and continuous area sampling selected in Step 5
- Allocated surveillance cost (Required for ‘cost’ or ‘saving’ optimisation, or if a cost unit is defined): The cost per unit of allocated surveillance when continuous surveillance selected in Step 3 and continuous effort selected in Step 5
- Fixed cost (Optional when cost unit is defined): Fixed additional cost applied to allocated locations or aspatial divisions (e.g. travel cost). Specify either:
- As a ‘single value’ for the entire study
- Vary values ‘across locations’ (raster or point) or ‘across divisions’ (aspatial), defined dependent on the division type selected in Step 4:
- Raster grid (GeoTIFF)
- Spatial locations – either select the checkbox “Use column ‘fixed_cost’ when included in Region CSV”, or define it separately by selecting another CSV file having aligned ‘lon’, ‘lat’, and ‘fixed_cost’ columns
- Other divisions – either select the checkbox “Use column ‘fixed_cost’ when included in Divisions CSV”, or define it separately by selecting another CSV file having aligned ‘id’ and ‘fixed_cost’ columns
- Existing sensitivity (Optional): Existing surveillance sensitivity (detection probability) at each spatial location or aspatial division. Useful for representing estimated general surveillance sensitivity. Defined dependent on the division type selected in Step 4:
- Raster grid (GeoTIFF)
- Spatial locations – either select the checkbox “Use column ‘exist_sens’ when included in Region CSV”, or define it separately by selecting another CSV file having aligned ‘lon’, ‘lat’, and ‘exist_sens’ columns
- Other divisions – either select the checkbox “Use column ‘exist_sens’ when included in Divisions CSV”, or define it separately by selecting another CSV file having aligned ‘id’ and ‘exist_sens’ columns
- Constraint (Required): The constraint for the resource allocation. Select:
- None – optimal balance between allocation costs and management costs or savings (only available for optimal cost or saving optimisation)
- Budget - total budget constraint, either:
- cost-based budget when cost unit is defined
- resource-based budget when cost unit is undefined
- Sensitivity – desired overall system-wide sensitivity or detection probability
- Total budget (Required when ‘budget’ constraint selected): The total cost-based or resource-based budget (as indicated or defined by the cost unit)
- System sensitivity (Required when ‘sensitivity’ constraint selected): The desired (minimum) system-wide sensitivity or detection probability of the surveillance design (e.g. 0.95)
- Discrete Allocation (Optional): Checkbox to indicate allocation should be whole numbers (e.g. traps, samples)
- Minimum Allocation (Optional): Minimum permissible allocation quantity (avoids infeasibly small allocations to locations)
Select “Save” if enabled (note that data file selection may autosave your selections).
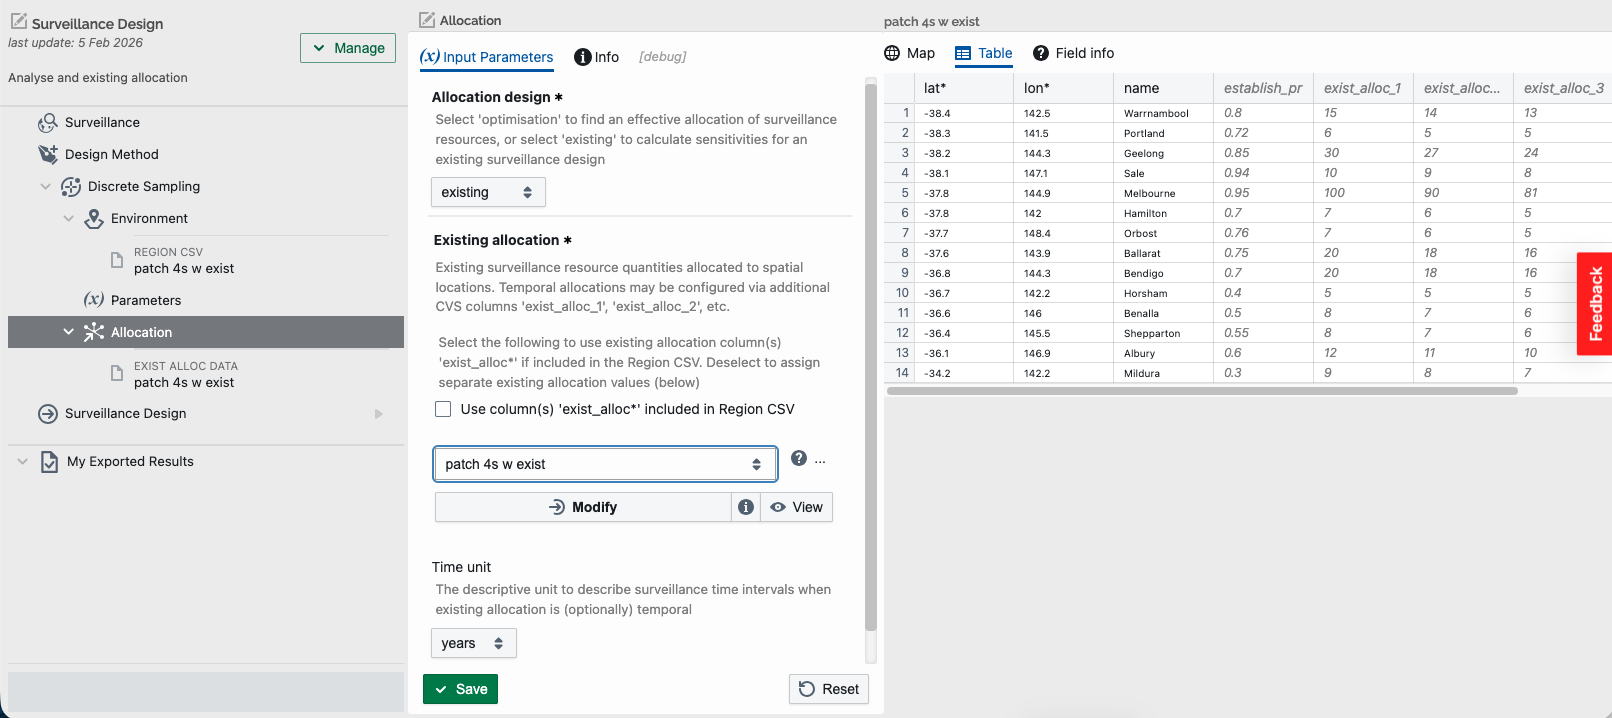
2. Existing
- Existing allocation (Required): Existing surveillance resource quantities allocated to spatial locations or aspatial divisions. Temporal allocations may be configured via multi-layered rasters or via additional columns in point-based or aspatial CSV files. Defined dependent on the division type selected in Step 4:
- Raster grid (GeoTIFF) – multi-layer for temporal allocations
- Spatial locations – either select the checkbox “Use column ‘exist_alloc*’ when included in Region CSV”, or define it separately by selecting another CSV file having aligned columns for ‘lon’, ‘lat’, and ‘exist_alloc’ (or ‘exist_alloc_1’, ‘exist_alloc_2’, etc., when temporal)
- Other divisions – either select the checkbox “Use column ‘exist_alloc*’ when included in Divisions CSV”, or define it separately by selecting another CSV file having aligned columns for ‘id’ and ‘exist_alloc’ (or ‘exist_alloc_1’, ‘exist_alloc_2’, etc., when temporal)
- Time unit (Optional): The descriptive unit to describe surveillance time intervals when existing allocation is (optionally) temporal. Select from:
- Years
- Months
- Weeks
- Days
- Hours
Select “Save” if enabled (note that data file selection may autosave your selections).
Step 7. Run the surveillance design
Once the Surveillance and Design Method branches and subbranches have been successfully configured you will be able to run your Surveillance Design, which will either:
- Find an effective allocation across spatial locations or aspatial divisions using the optimisation strategy, constraints, and other parameters configured in Step 6, and calculate the sensitivity (detection probability) for this allocation
- Calculate the sensitivity (detection probability) across spatial locations or aspatial divisions, as well as an overall system-wide sensitivity, for an existing surveillance resource allocation configured in Step 6. This may also be performed for temporal values when provided
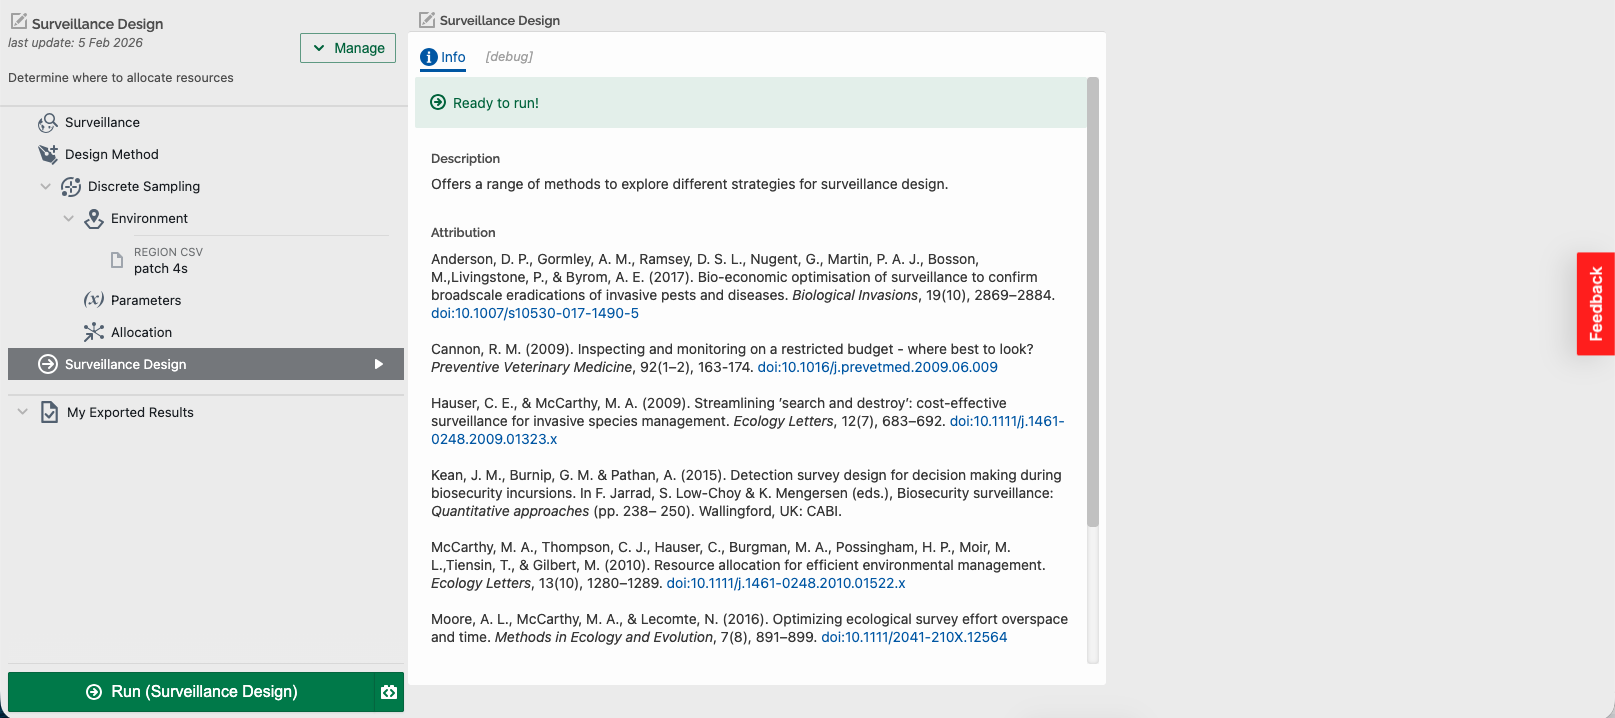
Click the ‘Run’ button in the bottom left to run your project. The output page will be updated as the job progresses from “Created”, “Submitted”, “Started” and “Success”.
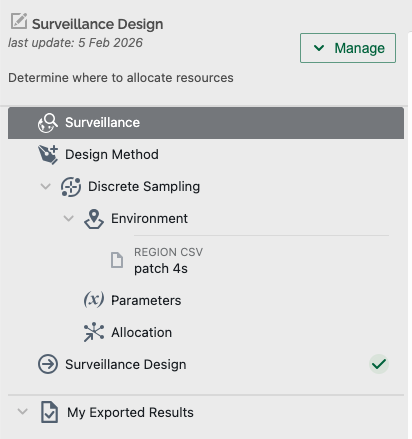
Once it has finished, a green tick will appear next to Surveillance Design.
The model surveillance allocation output may be displayed as a viewable allocation in the output pane The outputs provided depend on the design method and the environment region type selected by the user.
1. Optimal raster output
For optimal raster-based spatial surveillance designs the outputs will be presented, including maps of the spatial allocations, sensitivities, costs (when applicable), and other files.
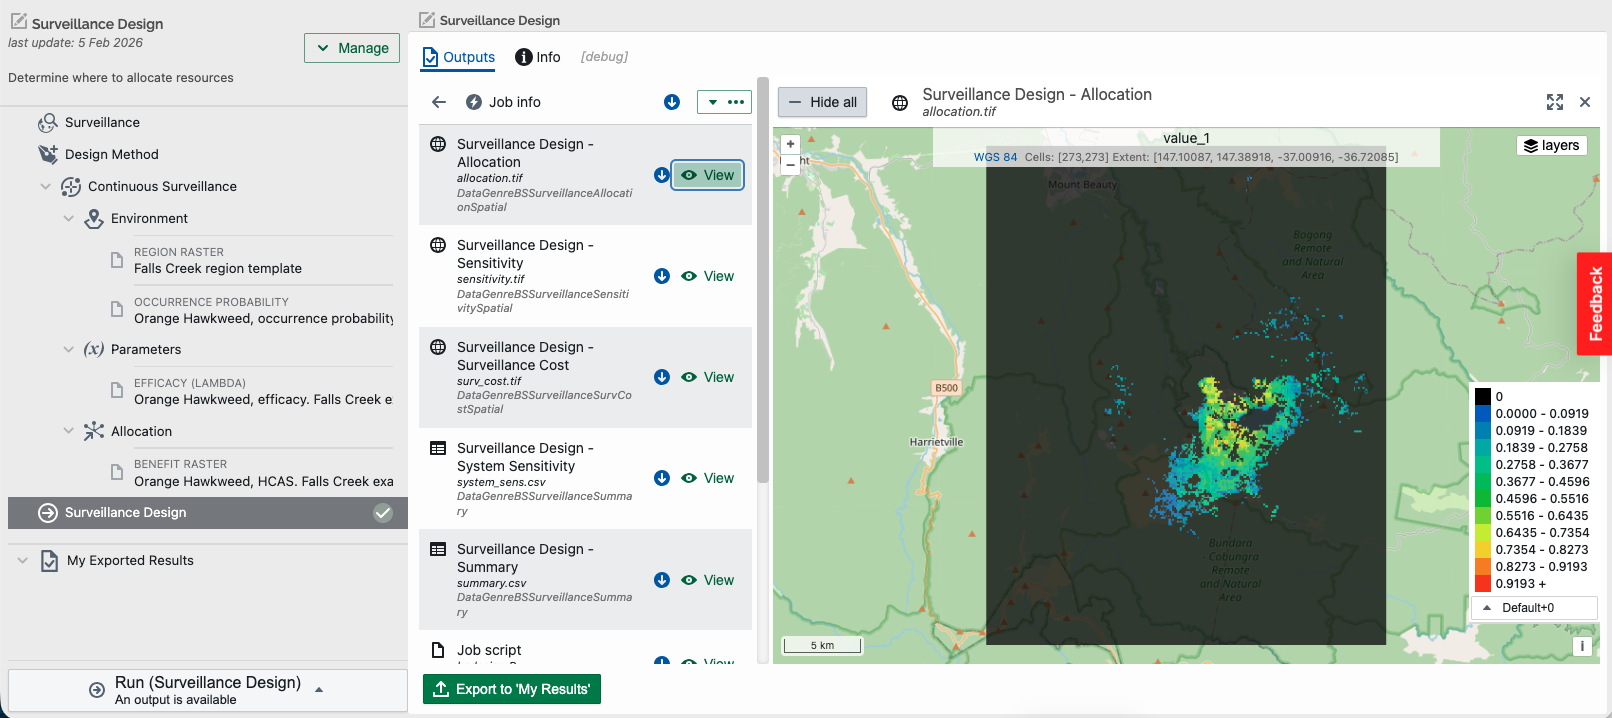
Users can zoom in or out of regions of interest. Interactive maps also allow users to change the type of legend displayed.
Clicking on the buttons allows users to view and download the outputs.
These optimal raster-based surveillance design outputs include:
- Surveillance Design – Allocation – A GeoTIFF containing the quantity of allocated surveillance resources across geographic space
- Surveillance Design – Sensitivity – A GeoTIFF of probabilities of detection given surveillance allocation. This file may be used to configure surveillance (or detection action) sensitivities within a Population Spread Model workflow
- Surveillance Design – Allocation Sensitivity – A GeoTIFF of probabilities of detection given surveillance allocation only, which is only present when optionally existing sensitivities are also specified
- Surveillance Design – Surveillance Cost – A GeoTIFF of surveillance costs given surveillance allocation (when costs are provided in the allocation parameters). This file may be used to configure surveillance (or detection action) costs within a Population Spread Model workflow
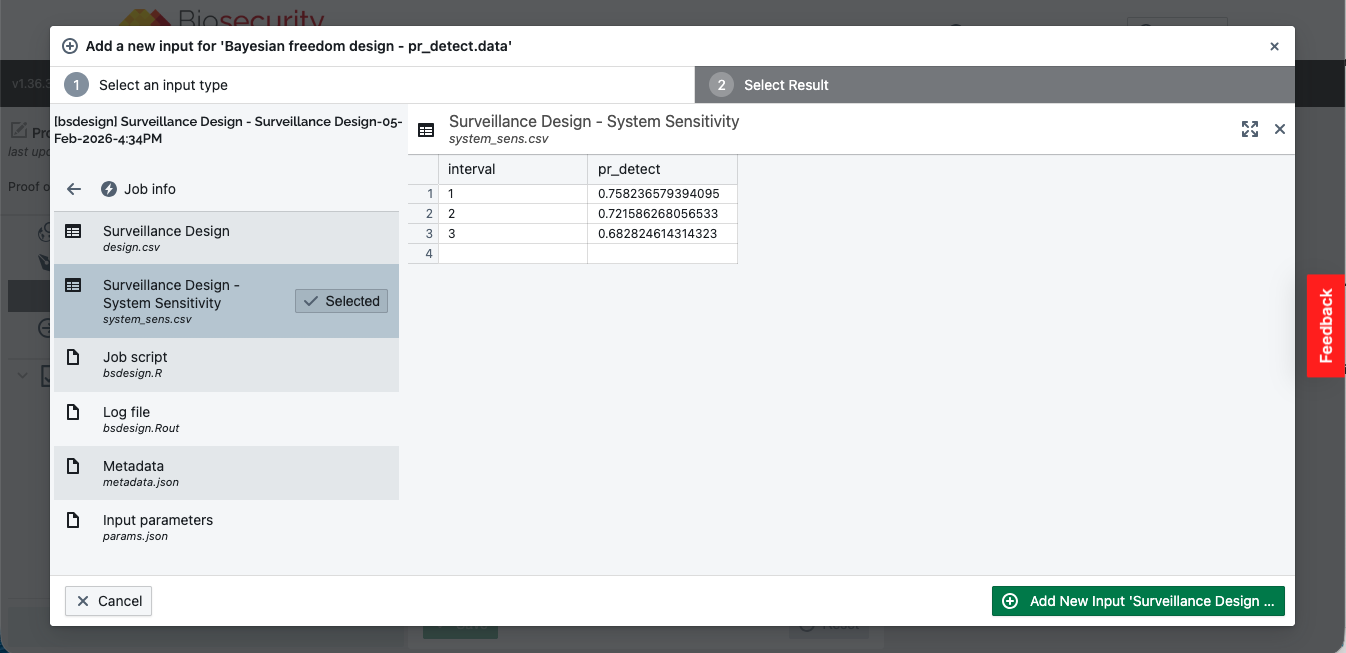
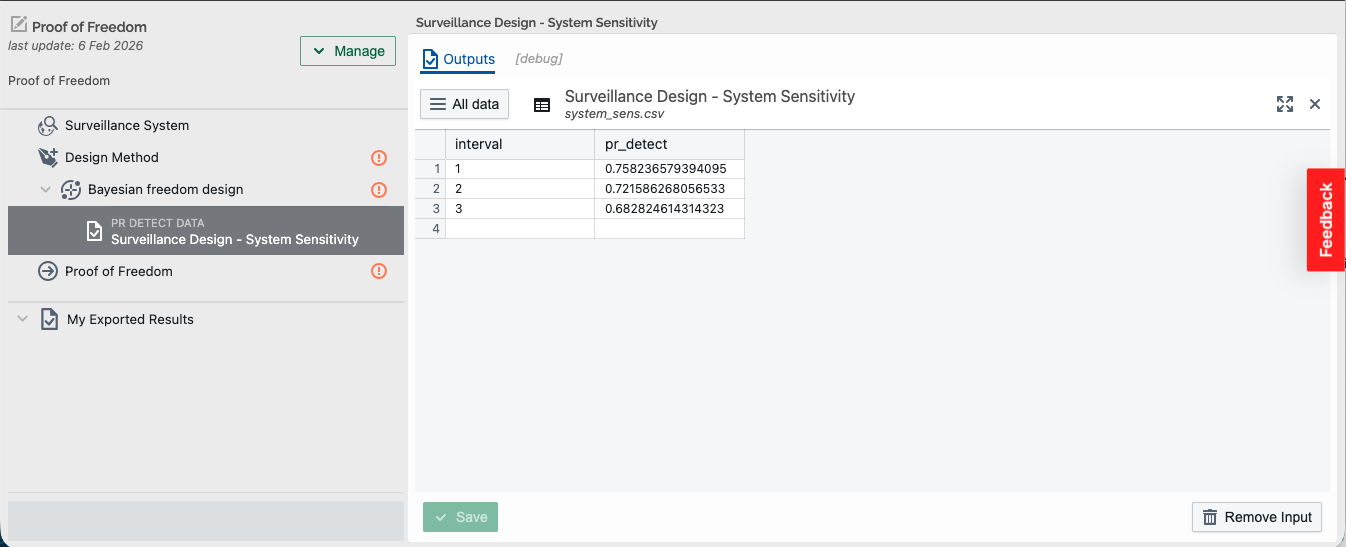
- Surveillance Design – System Sensitivity – A CSV file containing columns ‘interval’ (temporal index) and value for system-wide sensitivity (‘pr_detect’). This file may be used as an input for the Proof of Freedom workflow via saved results (see Step 8 for example)
- Surveillance Design – Summary – A CSV file containing summary information across the entire study regions, such as total allocation, total management & overall costs (when applicable), and system-wide sensitivity
- Job script – A copy of the R script used to build the risk map
- Log file – A text file containing processes, messages, and other details associated with model runs
- Metadata – A .json file containing the metadata required to run the model on Biosecurity Commons
- Input parameters – Input parameters required to run the Job Script
2. Optimal CSV output
For spatial locations (point-based) or other division (aspatial) optimal surveillance designs the outputs will include a table with the generated surveillance allocations and their corresponding sensitivity and surveillance costs (when applicable) for each spatial location or aspatial division appended to columns provided when defining the environment region or divisions.
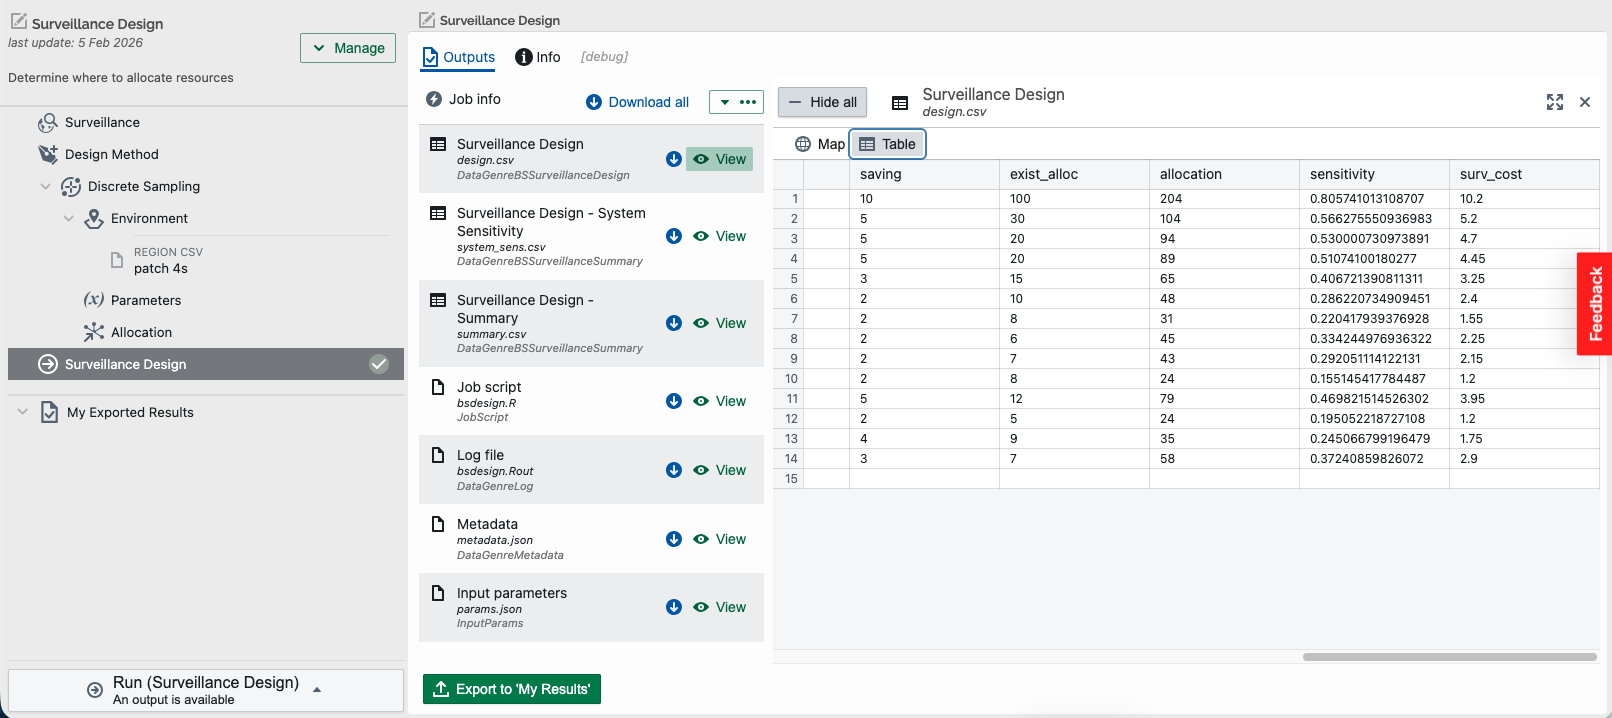
Clicking on the buttons allows users to view and download the outputs.
These optimal CSV-based surveillance design outputs include:
- Surveillance Design – A CSV containing generated surveillance allocations, the (overall) sensitivities, the sensitivities associated with the allocation only when existing sensitivities are provided, as well as surveillance costs (when costs are provided in the allocation parameters) for each spatial location or aspatial division appended to columns provided when defining the environment region or divisions. This file may be used to configure surveillance (or detection action) sensitivities and/or costs within a Population Spread Model workflow
- Surveillance Design – System Sensitivity – A CSV file containing columns ‘interval’ (temporal index) and value for system-wide sensitivity (‘pr_detect’). This file may be used as an input for the Proof of Freedom workflow via saved results (see Step 8 for example)
- Surveillance Design – Summary – A CSV file containing summary information across the entire study regions, such as total allocation, total management & overall costs (when applicable), and system-wide sensitivity
- Job script – A copy of the R script used to build the risk map
- Log file – A text file containing processes, messages, and other details associated with model runs
- Metadata – A .json file containing the metadata required to run the model on Biosecurity Commons
- Input parameters – Input parameters required to run the Job Script
3. Existing raster output
For existing raster-based spatial surveillance designs the output will present a map of the generated sensitivities corresponding to each (optionally temporal) existing allocation.
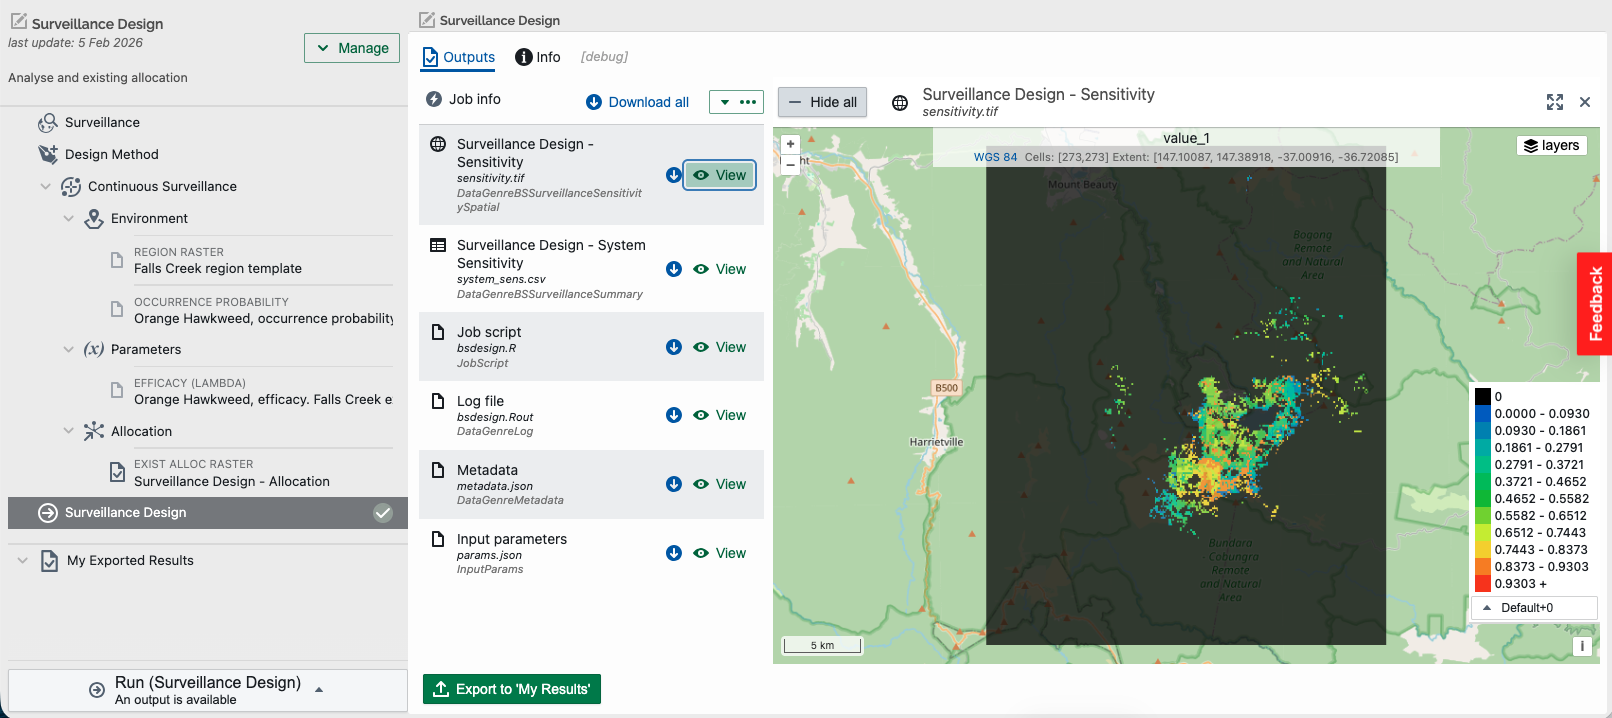
Clicking on the buttons allows users to view and download the outputs.
These existing raster-based surveillance design outputs include:
- Surveillance Design – Sensitivity – A GeoTIFF of probabilities of detection given existing surveillance allocation. When existing allocations were defined temporally via multiple raster layers, a corresponding sensitivity raster will be generated for each existing layer. This/these file/s may be used to configure surveillance (or detection action) sensitivities within a Population Spread Model workflow
- Surveillance Design – System Sensitivity – A CSV file containing columns ‘interval’ (temporal index) and value for system-wide sensitivity (‘pr_detect’). This file may be used as an input for the Proof of Freedom workflow via saved results (see Step 8 for example)
- Job script – A copy of the R script used to build the risk map
- Log file – A text file containing processes, messages, and other details associated with model runs
- Metadata – A .json file containing the metadata required to run the model on Biosecurity Commons
- Input parameters (All models): Input parameters required to run the Job Script
4. Existing CSV output
For existing point-based or aspatial surveillance designs the output will present a table with the generated sensitivities corresponding to each (optionally temporal) existing allocation for each spatial location or aspatial division appended to columns provided when defining the environment region or divisions.
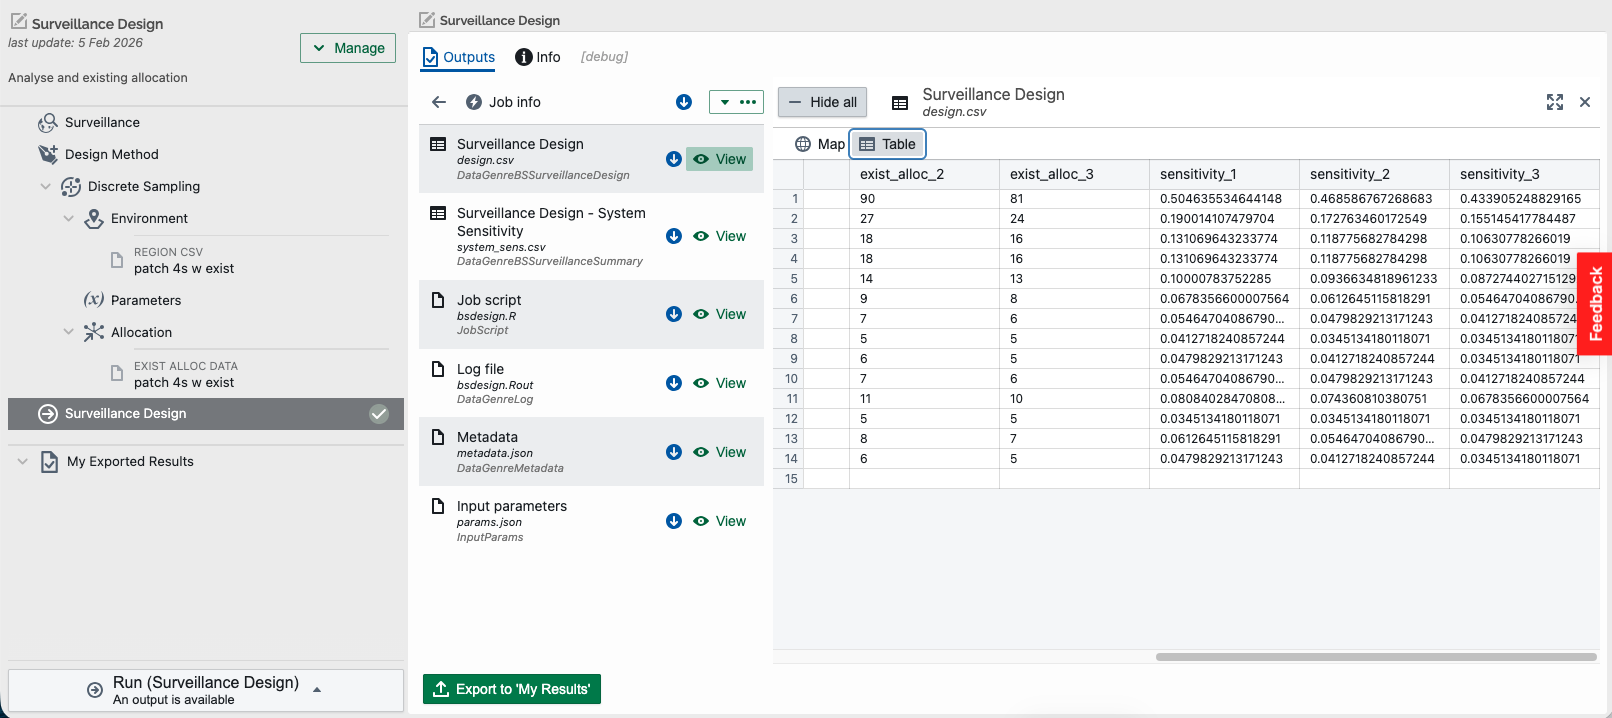
Clicking on the buttons allows users to view and download the outputs.
These existing CSV-based surveillance design outputs include:
- Surveillance Design – A CSV containing generated sensitivity corresponding to each (optionally temporal) existing allocation for each spatial location or aspatial division appended to columns provided when defining the environment region or divisions. This file may be used to configure surveillance (or detection action) sensitivities within a Population Spread Model workflow
- Surveillance Design – System Sensitivity – A CSV file containing columns ‘interval’ (temporal index) and value for system sensitivity (‘pr_detect’). This file may be used as an input for the Proof of Freedom workflow via saved results (see Step 8 for example)
- Job script – A copy of the R script used to build the risk map
- Log file – A text file containing processes, messages, and other details associated with model runs
- Metadata – A .json file containing the metadata required to run the model on Biosecurity Commons
- Input parameters – Input parameters required to run the Job Script
Step 8. Exporting outputs for use in other workflows
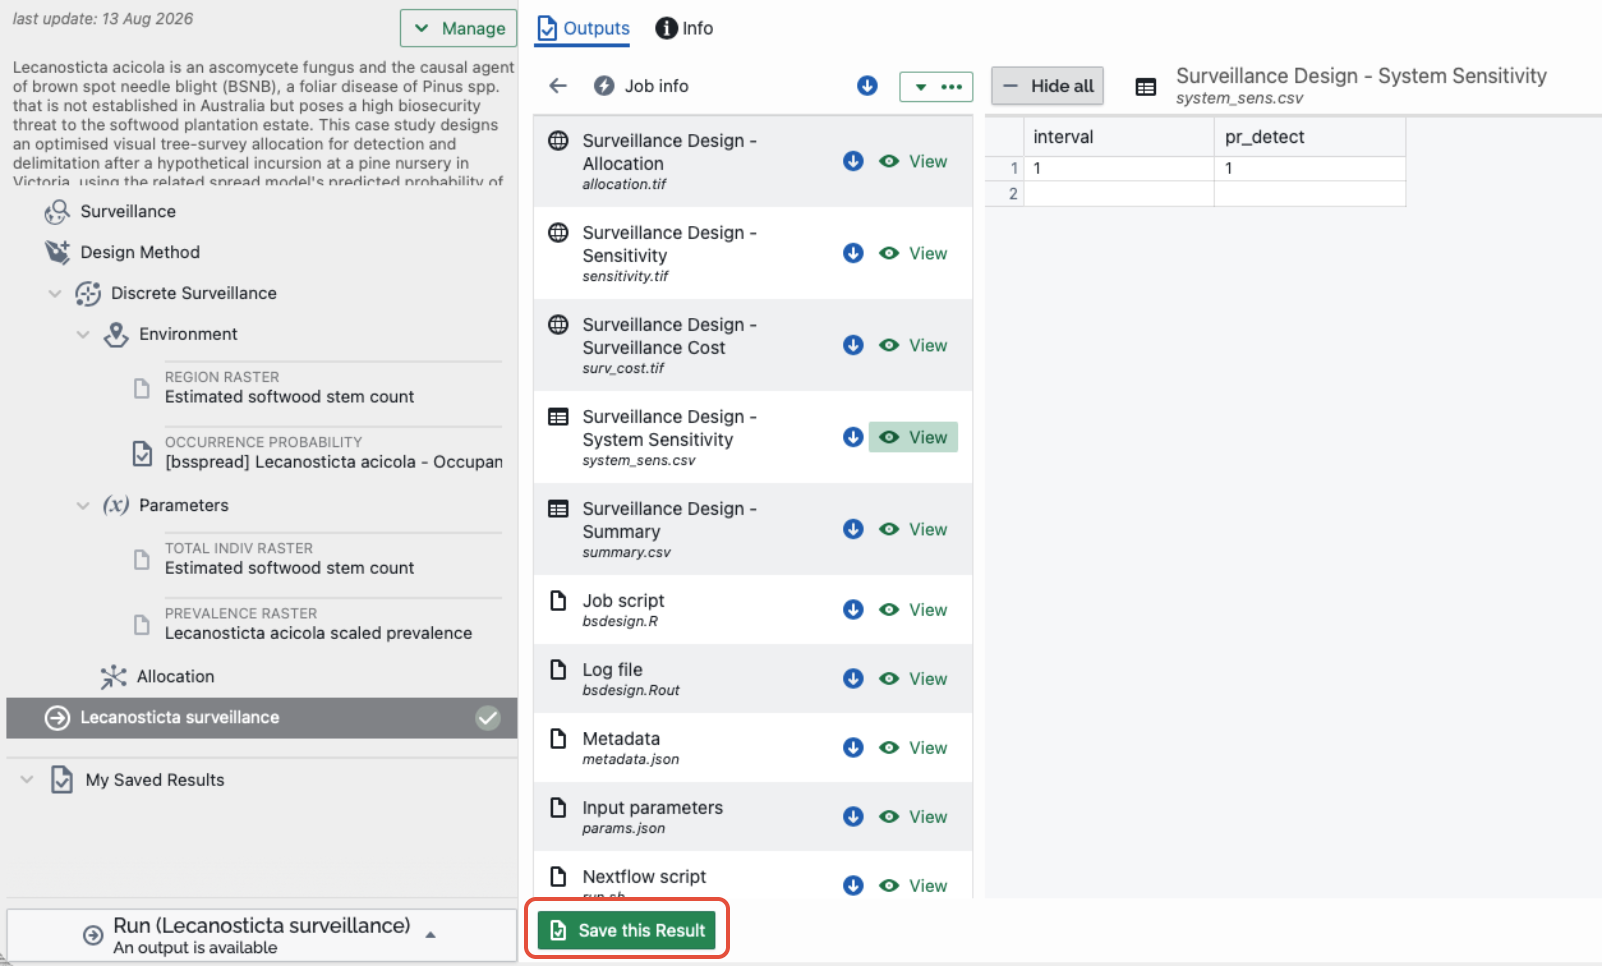
Users may wish to save outputs for use in other projects or other workflows. For example, the system sensitivity CSV file produced by a surveillance design may be used as an input for the Proof of Freedom workflow.
To do this select “Save this Result” in the bottom left corner of the output display.
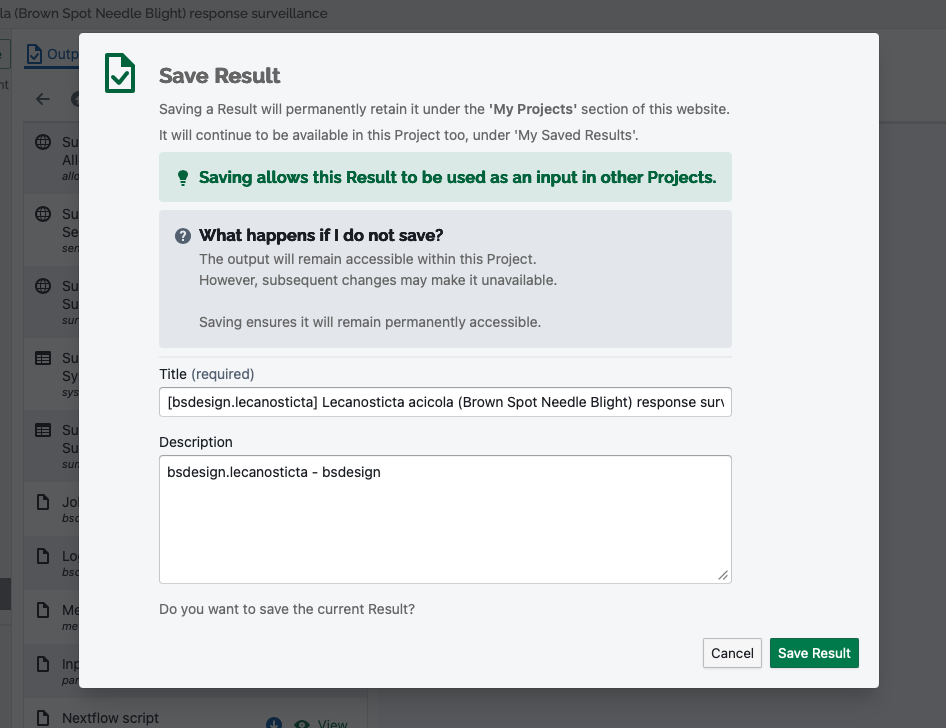
This output will now be discoverable in the user’s “My results” database, which in turn makes the layer available for use in other workflows.
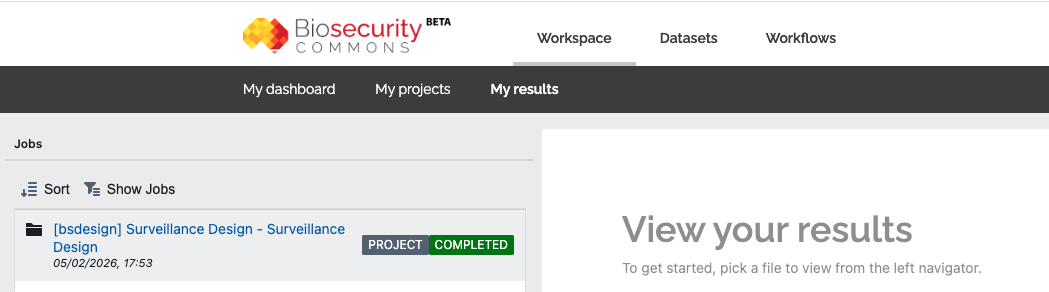
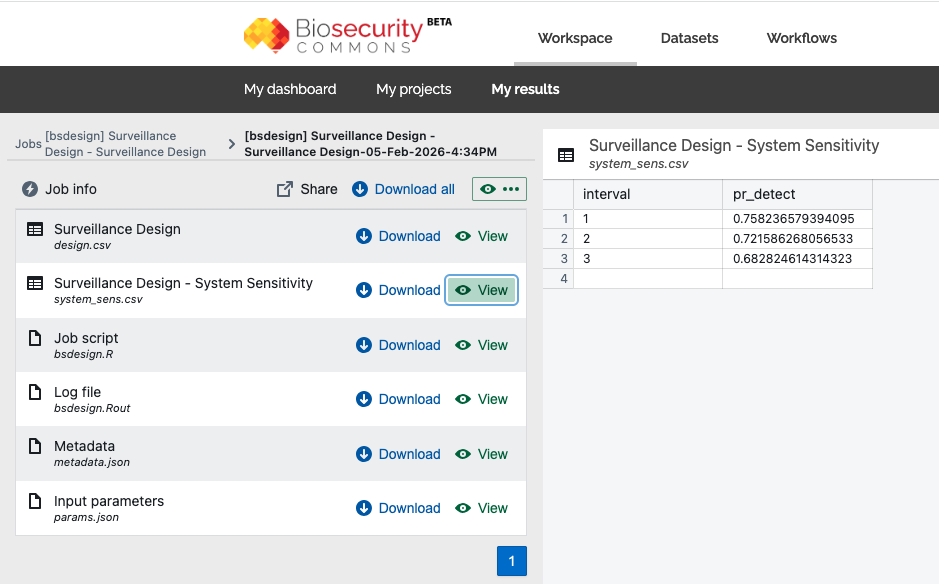
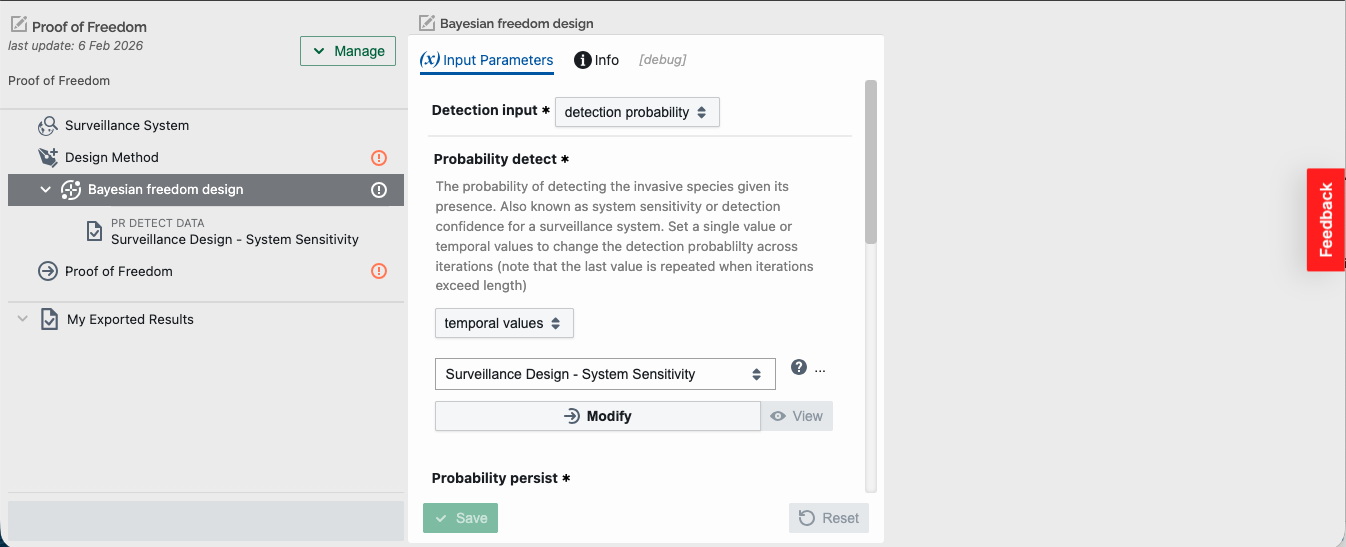
For example, within the Proof of Freedom workflow, the system sensitivity result may be utilised as an input (e.g. temporal values for the probability of detection). Refer to the Proof of Freedom support material for further information.
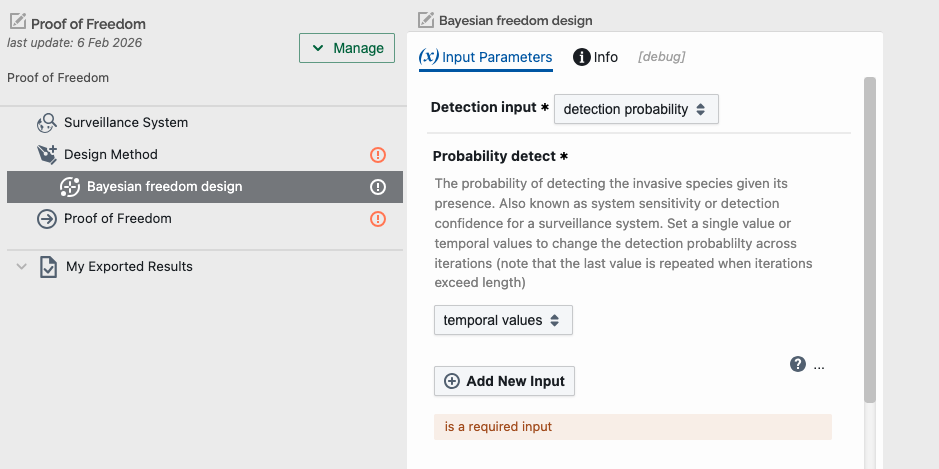
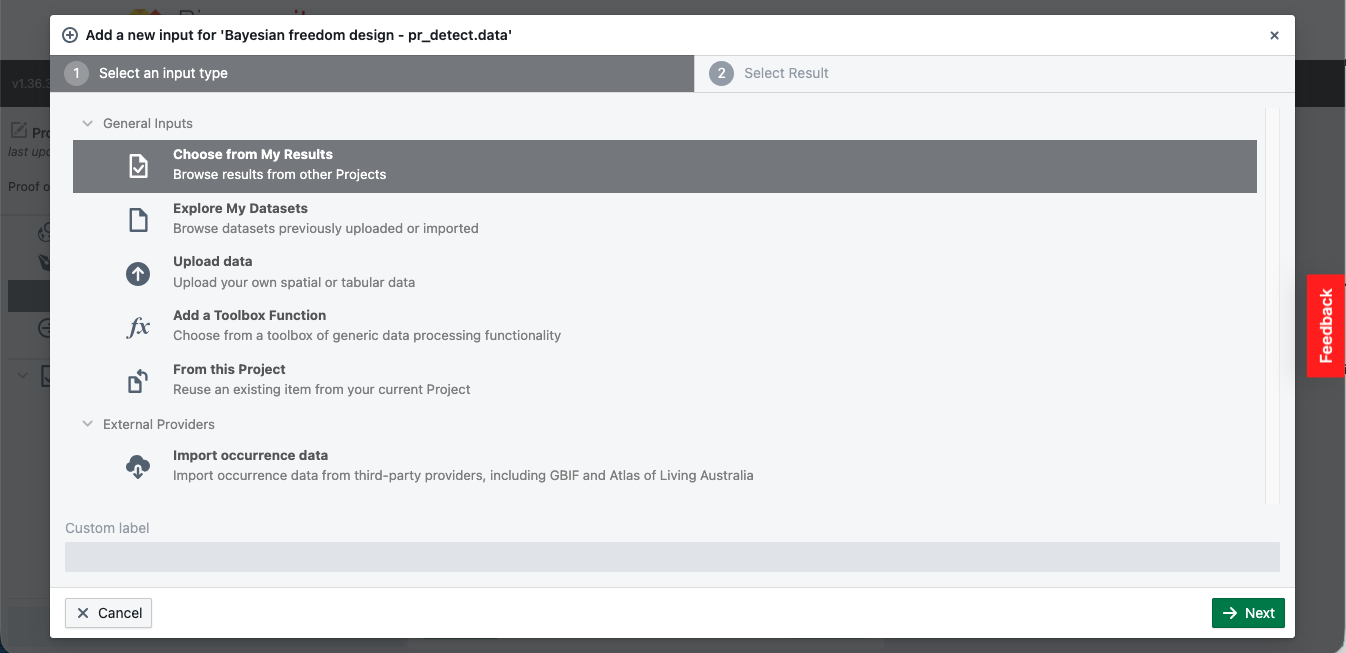
By selecting “Add New Input” then “Choose from My Results”, the desired result may be located and selected.
Was this article helpful?
That’s Great!
Thank you for your feedback
Sorry! We couldn't be helpful
Thank you for your feedback
Feedback sent
We appreciate your effort and will try to fix the article